


Trend analysis (Fig. 1).
The market will move up from the level of 1.2377 (closing of yesterday's daily candle) to test the historical resistance level of 1.2460 (blue dotted line). When testing this level, the price may continue to move upwards to 1.2524, the upper fractal (yellow dotted line).
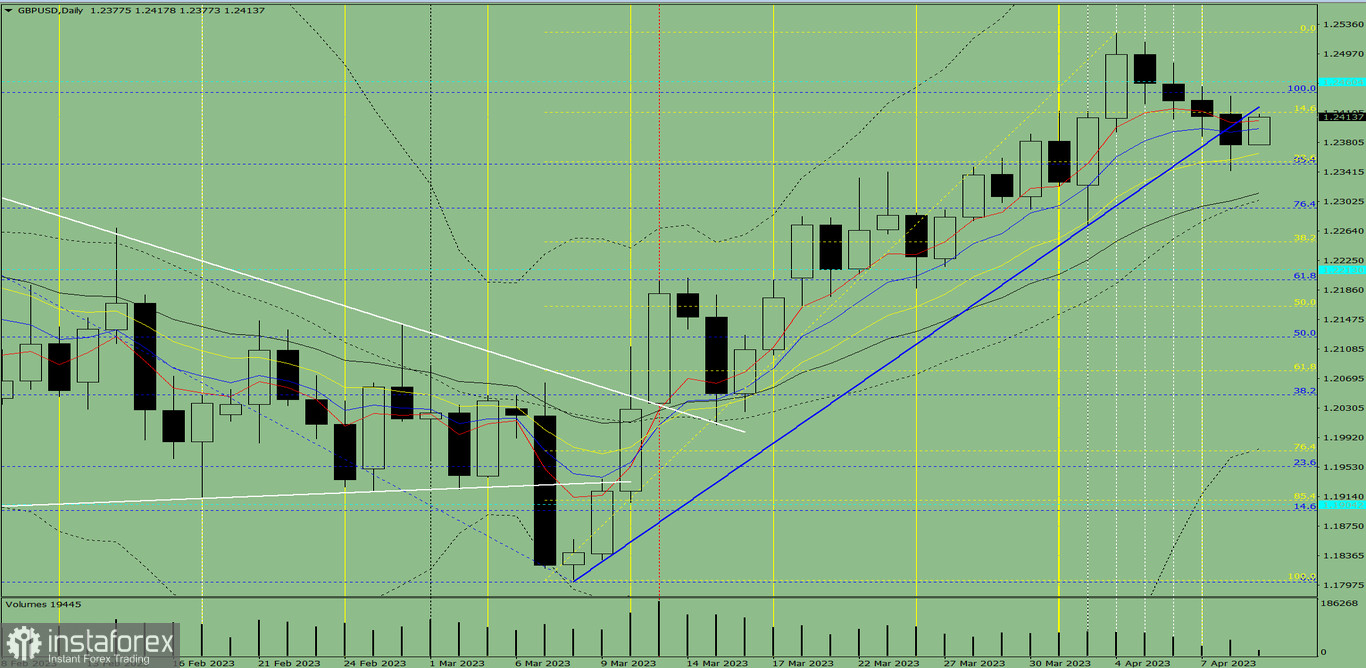
Fig. 1 (daily chart).
Comprehensive analysis:
- Indicator analysis - upward;
- Volumes - upward;
- Candle analysis - upward;
- Trend analysis - upward;
- Bollinger lines - upward;
- Weekly chart - upward.
Overall conclusion:
Today, the price will move up from the level of 1.2377 (closing of yesterday's daily candle) to test the historical resistance level 1.2460 (blue dotted line). When testing this level, the price may continue to move upwards to 1.2524, the upper fractal (yellow dotted line).
Alternatively, the price will move upward from the level of 1.2377 (closing of yesterday's daily candle) to test the historical resistance level 1.2460 (blue dotted line). When testing this level, the price may move downward to 1.2420, the 14.6% pullback level (yellow dotted line).


