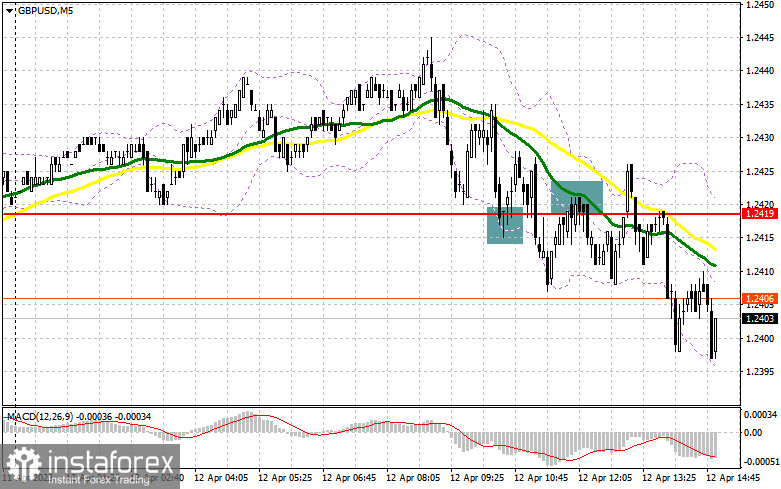
In my morning forecast, I called attention to the level of 1.2419 and recommended making decisions on entering the market from there. Let's look at the 5-minute chart and figure out what happened there. The decline and formation of a false breakout at 1.2419 provided a buy signal, but as you can see on the chart, it didn't fully materialize. After some time, there was a breakthrough and a retest of 1.2419, which led to a sell signal. When writing the article, the pair had dropped about 20 points. The technical picture stayed the same in the second half of the day.

To open long positions on GBP/USD, it is required:
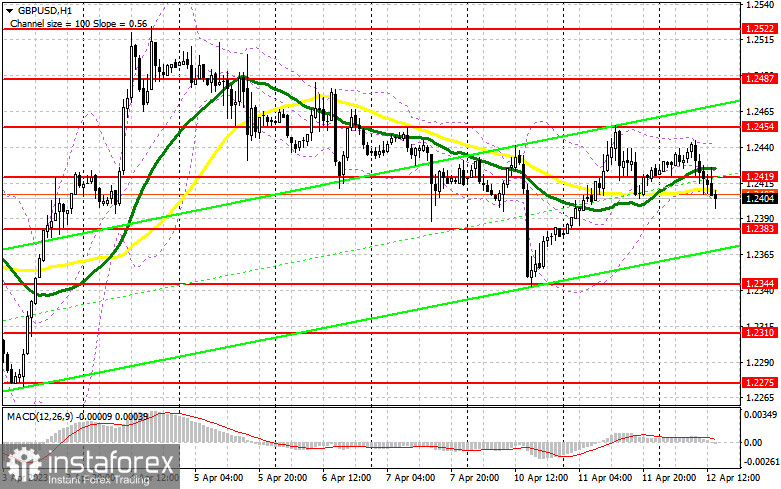
The lack of statistics allowed the pound to correct significantly after the growth observed during the Asian session. But you all understand that the future direction entirely depends on inflation in the US. The core price component, which does not consider volatile categories, is much more interesting. For this reason, I advise to take your time with market entries and wait for the results. US inflation will be better than economists' forecasts, which, in theory, should trigger pound purchases. If prices remain high, pressure on the pair will most likely increase. In this scenario, only a decline and the formation of a false breakout at 1.2383 will provide a good signal to open long positions to resume pound growth and return to the 1.2419 resistance level, where the moving averages are already on the bears' side. A breakthrough and a test of this area from top to bottom against the backdrop of the Bank of England governor's hawkish rhetoric and rapidly falling inflation in the US will provide an even greater impulse and entry point for long positions with the prospect of growth to 1.2454. The ultimate target will be the 1.2487 area, and nearby is the monthly high of 1.2522, where I recommend locking in profits. If the scenario involves a decrease to the 1.2383 area and no bullish activity in the second half of the day, it's better not to rush with purchases. In this case, I will open long positions only on a false breakout in the area of the next support 1.2344 – this week's low. I plan to buy GBP/USD immediately on the rebound from the 1.2310 low with a 30-35 point correction target within the day.
To open short positions on GBP/USD, it is required:
Considering that buyers had no particular desire to protect 1.2419, all they need now is to regain control of this area. Sellers, focusing on the consumer price index and Andrew Bailey's speech, will resist this development. In case of an upward surge after the data, the defense and formation of a false breakout at 1.2419 will become an excellent signal to sell the pound further, with the prospect of updating 1.2383 – intermediate support. A breakthrough and a bottom-up retest of this range will increase pressure on the pair, forming a sell signal with a drop to 1.2344, where bears will again encounter active actions from pound buyers. The ultimate target remains the low of 1.2310, the test of which will be possible in the case of a sharp increase in inflation in the US, not a decrease, as everyone expects. In case of GBP/USD growth and lack of activity at 1.2419 during the US session, which is more likely, it's better to postpone sales until testing yesterday's high of 1.2454. Only a false breakout there will provide an entry point for short positions. If there is no downward movement, I will sell GBP/USD from 1.2487, but only on a false breakout. I prefer to open short positions on a rebound only in the area of the monthly high of 1.2522 and only in anticipation of a pair correction down by 30-35 points within the day.

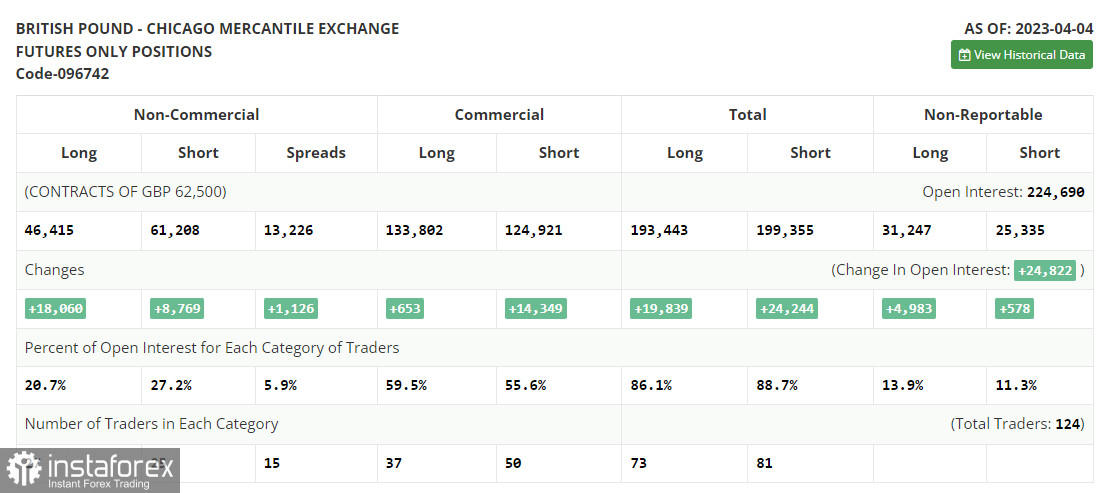
The COT report (Commitment of Traders) for April 4 showed an increase in both long and short positions. However, this did not greatly affect the downward correction of the pair, which, judging by the chart, is gradually approaching its completion. This week, more data on the UK GDP growth rates are expected, which may be enough for pound buyers to maintain the initiative and return to monthly highs. No statements are expected from the Bank of England representatives, so how the market reacts to US inflation and retail sales data is also very important. These figures can bring strength back to the US dollar. The latest COT report states that short non-commercial positions increased by 8,769 to 61,109. In contrast, long non-commercial positions jumped by 18,060 to 46,415, leading to a sharp reduction in the negative value of the non-commercial net position to -14,793 versus -24,084 a week earlier. The weekly closing price rose and amounted to 1.2519 against 1.2241.

Indicator signals:
Moving Averages
Trading is conducted in the area of the 30 and 50-day moving averages, indicating market uncertainty.
Note: The author on the H1 chart considers the period and prices of moving averages and differ from the general definition of classical daily moving averages on the D1 chart.
Bollinger Bands
In case of a decline, the lower border of the indicator at 1.2401 will act as support.
Description of indicators
• Moving average (determines the current trend by smoothing volatility and noise). Period 50. Marked in yellow on the chart.
• Moving average (determines the current trend by smoothing volatility and noise). Period 30. Marked in green on the chart.
• MACD indicator (Moving Average Convergence/Divergence - convergence/divergence of moving averages) Fast EMA period 12. Slow EMA period 26. SMA period 9
• Bollinger Bands. Period 20
• Non-commercial traders - speculators, such as individual traders, hedge funds, and large institutions that use the futures market for speculative purposes and meet certain requirements.
• Long non-commercial positions represent the total long open position of non-commercial traders.
• Short non-commercial positions represent the total short open position of non-commercial traders.
• The total non-commercial net position is the difference between the short and long positions of non-commercial traders.


