


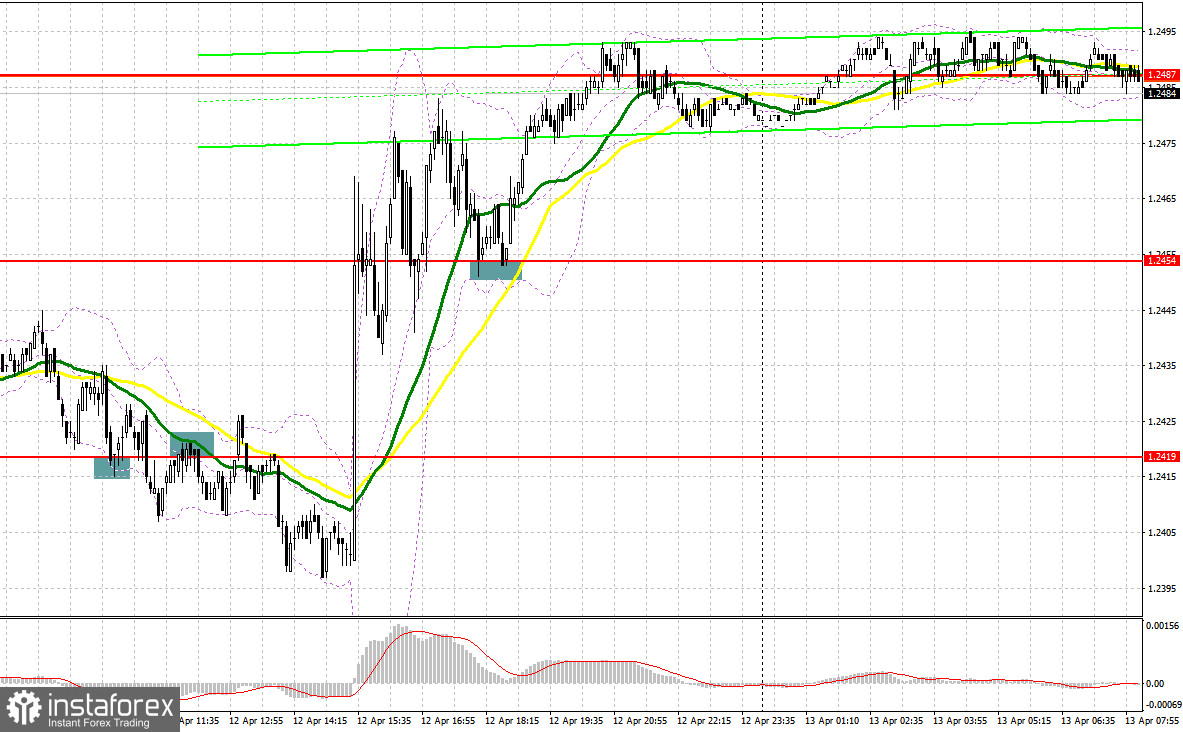
Yesterday, several market entry signals were generated. I suggest you examine the 5-minute chart to determine what happened. In my morning forecast, I paid close attention to level 1.2419 and recommended making entry decisions there. The decline and formation of a false breakout at 1.2419 enabled us to obtain a buy signal, but as the chart demonstrates, it was not completely realized. After some time, 1.2419 was broken and retested, triggering a sell signal. The decline was approximately 20 points. The afternoon breakout and retest of 1.2454 provided a point of entry into long positions. As a result, the pair gained approximately 40 points.
To establish long positions on the GBP/USD, you must:
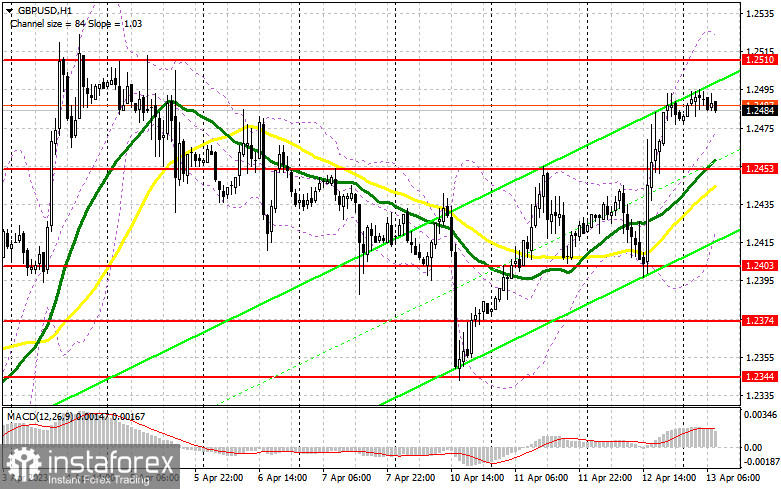
Today we await a relatively large number of UK statistics, and the pound will have a strong opportunity to extend the bull market formed yesterday following the US inflation data. The growth of the United Kingdom's gross domestic product and industrial production will strengthen the confidence of purchasers of the pound, giving the pair upward momentum. The balance of visible commerce and Hugh Pill's speech as a member of the MPC of the Bank of England will be of secondary importance. If the GBP/USD pair prefers to demonstrate a downward correction in the first half of the trading session, 1.2453 will be a decent option for buying. The formation of a false breakout will ensure that there are buyers in the market, which will be an excellent signal to open long positions with a return to 1.2510, which is nearly the monthly maximum. A breakout and a top-to-bottom test of this area would provide another entry point into long positions with the possibility of a return to 1.2551, where I would suggest taking profits. The area around 1.2592 will be the furthest target, but it will only be reached in the event of weak US data. In the event of a decline to 1.2453, where the moving averages are located, and the absence of bullish activity, it is advisable not to hurry into purchases. In this case, I will only initiate long positions on a false breakout in the area of 1.2403's next support. I intend to purchase GBP/USD immediately for a rebound only from this week's low of 1.2374, aiming towards a 30-35 point correction within a day.
To initiate short GBP/USD positions, you must have the following:
Around 1.2510, sellers must demonstrate their worth, as this is their last chance. Only a false breakout there will allow for a correction with the possibility of a return to 1.2453, where the bullish moving averages are in action. A test of this area following a failed attempt to exit beyond the monthly maximum will lock the pair into a side channel. A breakout and a reverse test from the bottom up of 1.2453 against the backdrop of weak UK statistics will increase pressure on the pound, forming a sell signal with a decline to 1.2403, but it is unlikely that we can break below today. The farthest target remains at least 1.2374. With the possibility of GBP/USD growth and lack of activity at 1.2510, which is quite probable, it is best to delay sales until the maximum of 1.2551 is tested. Only a false breakout will provide a point of entry into short positions. Without a decline there, I will sell GBP/USD for an imminent rebound from the day's high of 1.2592, but only if the pair corrects lower by 30-35 points within the day.
Signals from indicators:
Moving Averages
Trading occurs above the 30-day and 50-day moving averages, indicating the pair's growth.
The author considers the period and values of moving averages on the hourly chart H1, which differ from the classic definition of daily moving averages on the daily chart D1.
Bollinger Bands
In the event of a decline, the indicator's lower limit near 1.2430 will provide support.
Description of indicators
- Moving average (moving average determines the current trend by smoothing volatility and noise). Period 50. It is highlighted in yellow on the graph.
- Moving average (moving average determines the current trend by smoothing volatility and noise). Period 30. On the graph, it is indicated by a green color.
- Moving Average Convergence/Divergence (convergence/divergence of moving averages) is the MACD indicator. Period 12 of the EMA with the fastest speed. EMA period 26 is slow. SMA period 9
- Bollinger Bands (Bollinger Bands). Phase 20
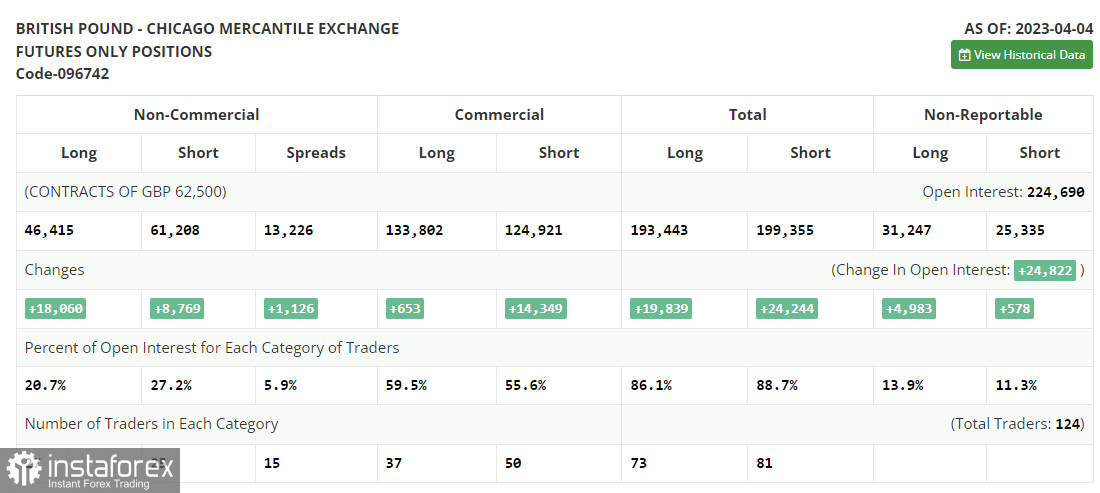
- Non-profit speculative traders, including individual traders, hedge funds, and large institutions, use the futures market for speculative purposes and satisfy certain criteria.
- The total open long positions held by non-commercial traders are long non-commercial positions.
- Short non-commercial positions represent the total short open position held by non-commercial traders.
- The entire non-commercial net position is the difference between non-commercial traders' short and long positions.


