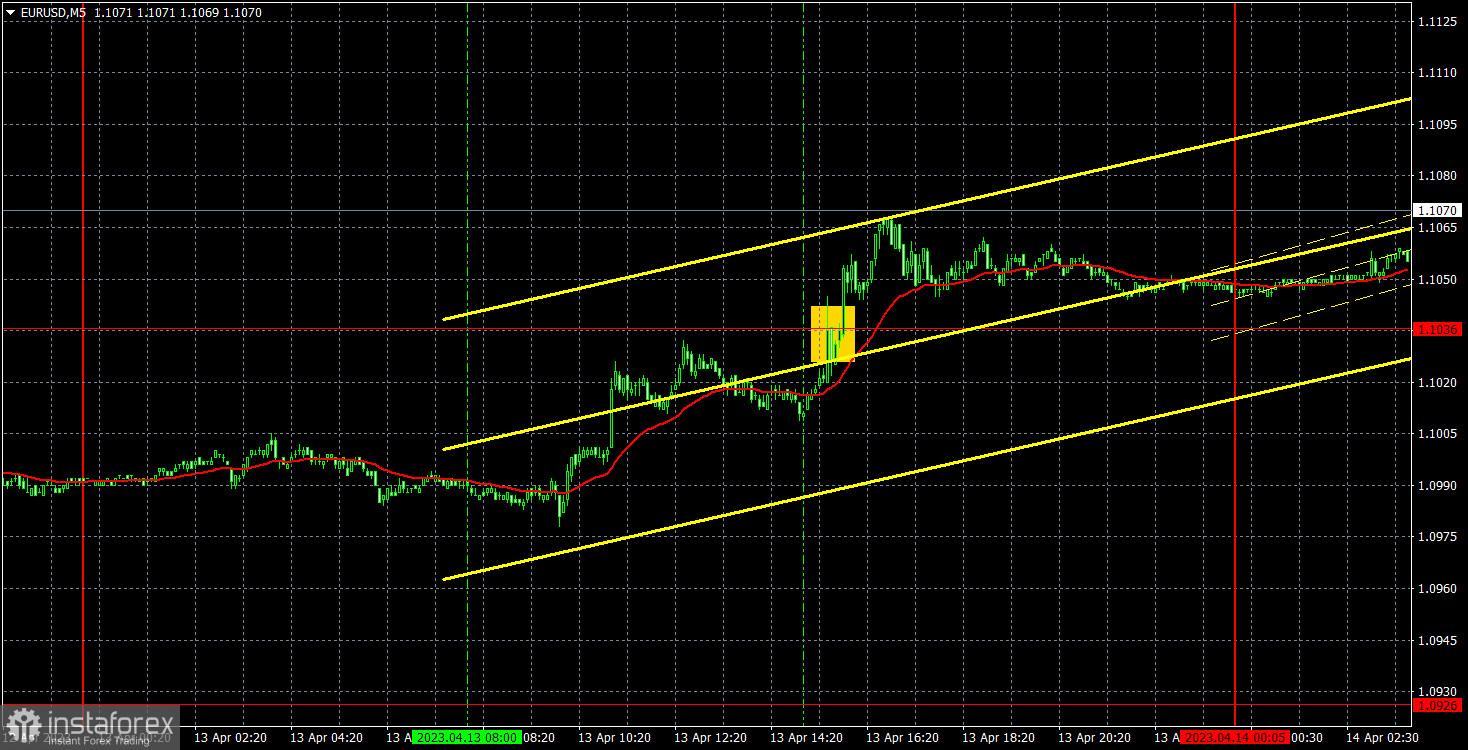
5M chart of EUR/USD

EUR/USD remained firm on Thursday. If earlier, someone might have doubted the euro's grounds for growth, now all doubts should evaporate. The euro is growing simply every day, and traders use any reason to open even more long positions. The pair cannot even properly correct, and the Ichimoku indicator lines are already far below the current price. Yesterday, an industrial production report was published in the European Union, which turned out to be stronger than forecasts. And in the United States, the producer price index was released, which fell more than expected. Both of these reports supported the euro. And it would be fine if the euro had not started rising just a few hours before the first report was released. Today, we have the same picture: not a single event has happened yet, and the euro is still moving forward in its upside journey. Therefore, we conclude that the upward momentum persists.
Yesterday, only one signal was formed. At the beginning of the US trading session, the pair crossed 1.1036, but by that time, most of the upward movement had already ended. Nevertheless, this signal didn't bring about a loss, because the pair still managed to cover several tens of points in the right direction. That's how much traders could earn.
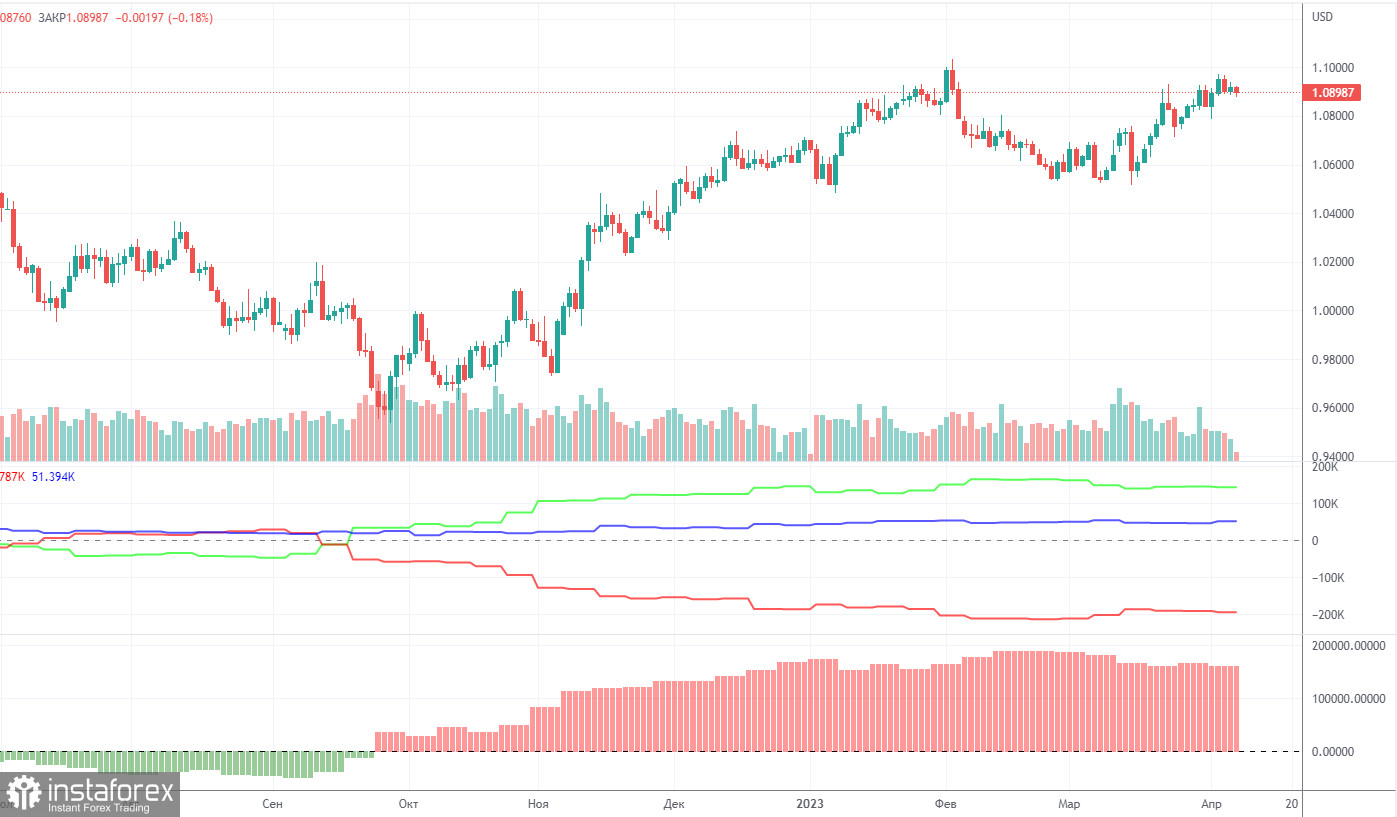
COT report:

On Friday, a new COT report for April 4th was released. The CFTC has caught up with the lost time and now publishes reports that correspond to the current time period. In the past few months, the picture has been entirely consistent with what has been happening in the market. The picture above clearly shows that the net position of major players (the second indicator) has been growing since the beginning of September 2022. At the same time, the European currency also began to rise. At the moment, the net position of non-commercial traders remains bullish and very high, as does the position of the European currency, which cannot even properly correct downward. Importantly, a relatively high "net position" value suggests the scenario that an uptrend will be over soon. This is signaled by the first indicator, where the red and green lines have moved far apart from each other, which often prefaces the end of a trend. The European currency tried to go down, but we have only seen a minor downward retracement so far. During the last reporting week, the number of Buy contracts among the non-commercial group increased by 2,500, while the number of short contracts rose by 4,100. Accordingly, the net position has hardly changed. The number of long positions is higher than the number of shorts among non-commercial traders by 143,000. A correction is still on the horizon, so even without COT reports, it is clear that EUR/USD should resume its decline.
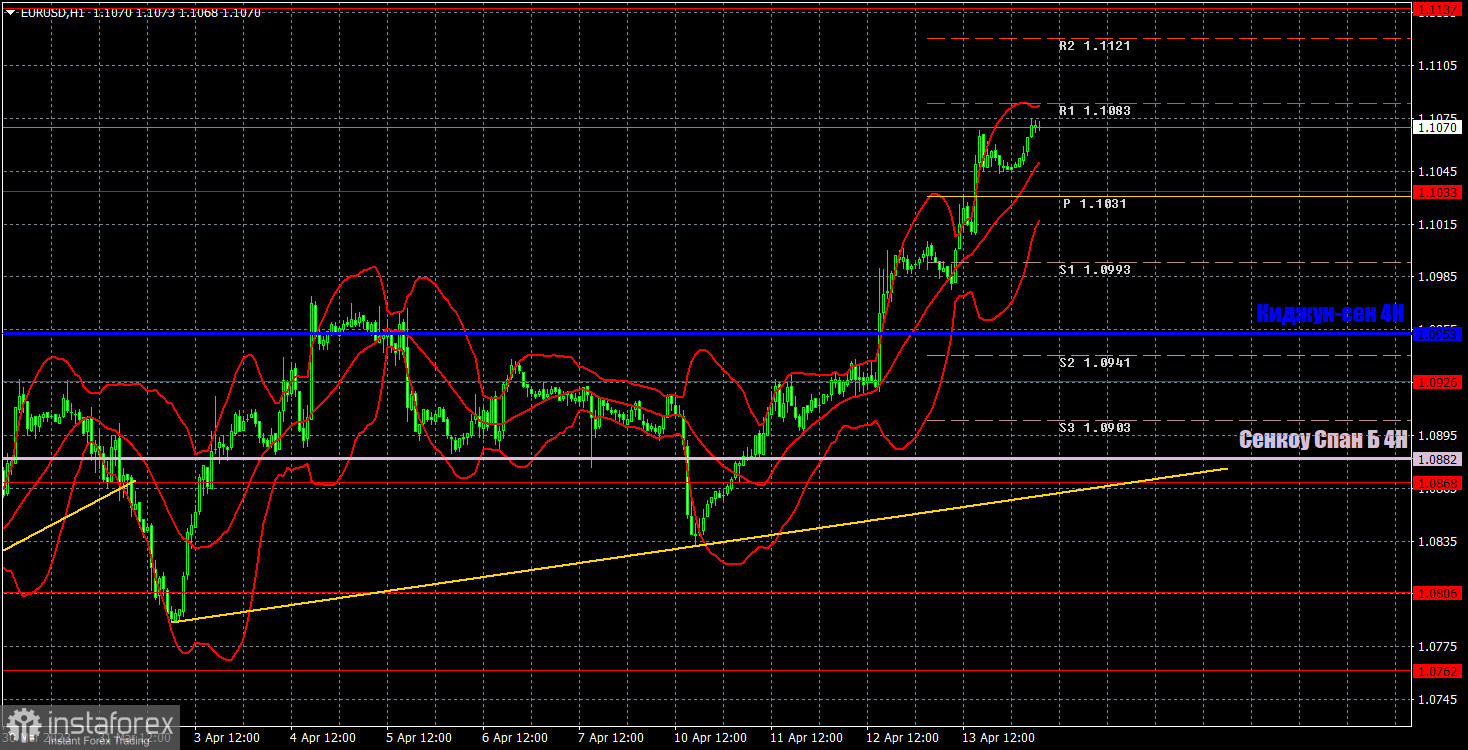
1H chart of EUR/USD

On the one-hour chart, the pair maintains the uptrend, as shown by the fact that it's staying above both the trend line and the Ichimoku indicator lines. We can only consider the possibility of starting a downtrend once the pair consolidates below the Ichimoku indicator lines on the daily chart. But so far this seems quite difficult. Traders refuse to sell, and without short positions, we won't see a correction. On Friday, important levels are seen at 1.0658-1.0669, 1.0762, 1.0806, 1.0868, 1.0926, 1.1033, 1.1137-1.1185, 1.1234, 1.1274, as well as Senkou Span B (1.0882) and Kijun-sen (1.0953) lines. Ichimoku indicator lines can move intraday, which should be taken into account when determining trading signals. There are also support and resistance although no signals are made near these levels. They could be made when the price either breaks or rebounds from these extreme levels. Do not forget to place Stop Loss at the breakeven point when the price goes by 15 pips in the right direction. In case of a false breakout, it could save you from possible losses. On April 14, there are no important reports or events in the European Union. On the other hand, the US will release reports on industrial production, retail sales, and the University of Michigan consumer sentiment index. Not the most important reports, but the market still uses any opportunity to stay bullish on the euro. If the report values are in favor of the dollar, traders might ignore this.
Indicators on charts:
Resistance/support - thick red lines, near which the trend may stop. They do not make trading signals.
Kijun-sen and Senkou Span B are the Ichimoku indicator lines moved to the hourly timeframe from the 4-hour timeframe. They are also strong lines.
Extreme levels are thin red lines, from which the price used to bounce earlier. They can produce trading signals.
Yellow lines are trend lines, trend channels, and any other technical patterns.
Indicator 1 on the COT chart is the size of the net position of each trader category.
Indicator 2 on the COT chart is the size of the net position for the Non-commercial group of traders.


