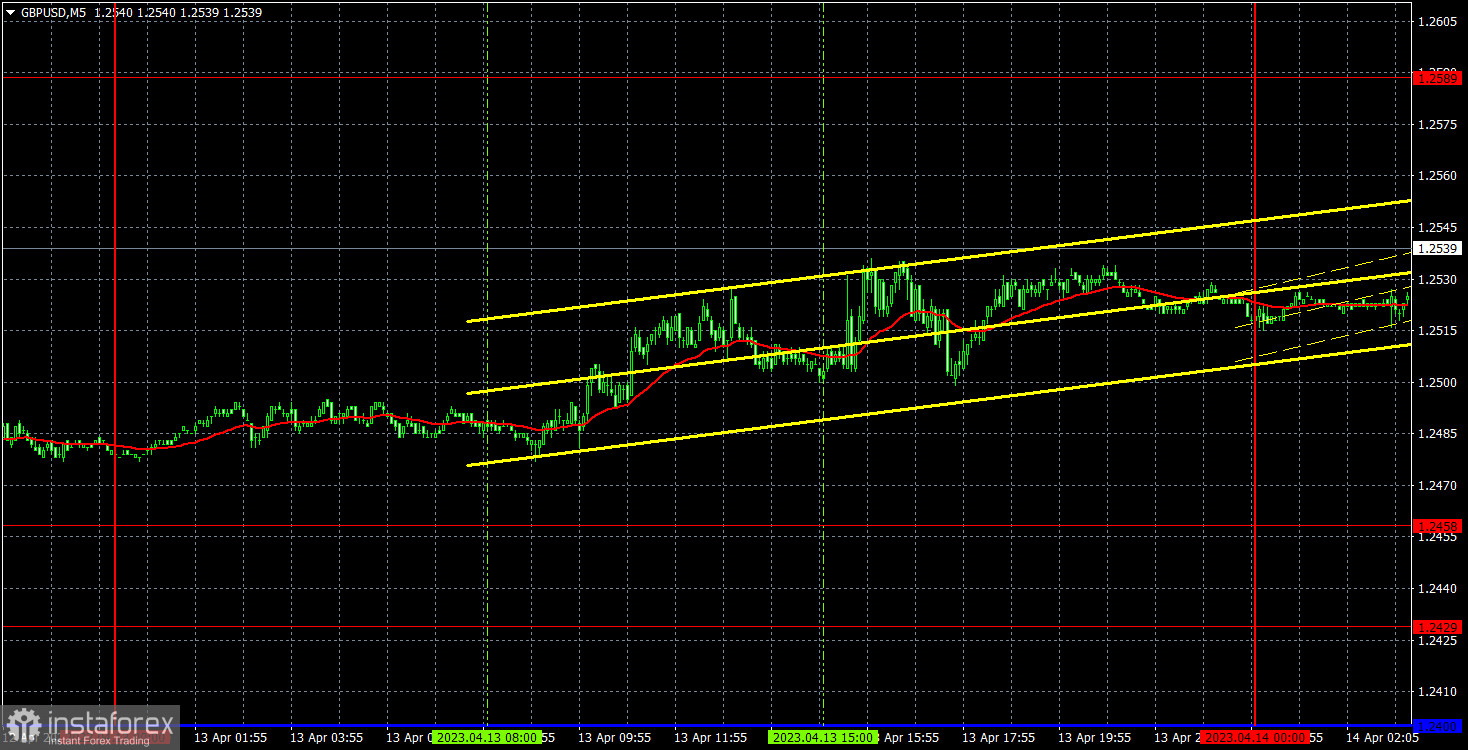
5M chart of GBP/USD

The GBP/USD pair traded in a similar style to the EUR/USD pair on Thursday. The pound strengthened, maybe less than the euro, but it still appreciated. In the morning, the UK published reports on GDP and industrial production, which turned out to be weaker than expected. Therefore, there was no support for the British currency, as with the euro. Nevertheless, even in such conditions, the British pound edged up most of the day. This is another piece of evidence which proves that traders simply refuse to sell the pair under any fundamental and macroeconomic background. The pair has already moved away from the Ichimoku indicator lines and the trend, so we should admit: a new local uptrend has started. And the current trend line is already the third or fourth consecutive one.
Yesterday, there were no trading signals due to low volatility. I believe that the movement wasn't the best, so it's a good thing that there were no signals. Although we have been observing an uptrend for a long time, such movement is not always favorable. In regards to corrections, new trades along the trend are usually opened. And if there are no corrections, you can't open new positions. And as we can see, the pound's upward march persists even if there are currently no corrections.
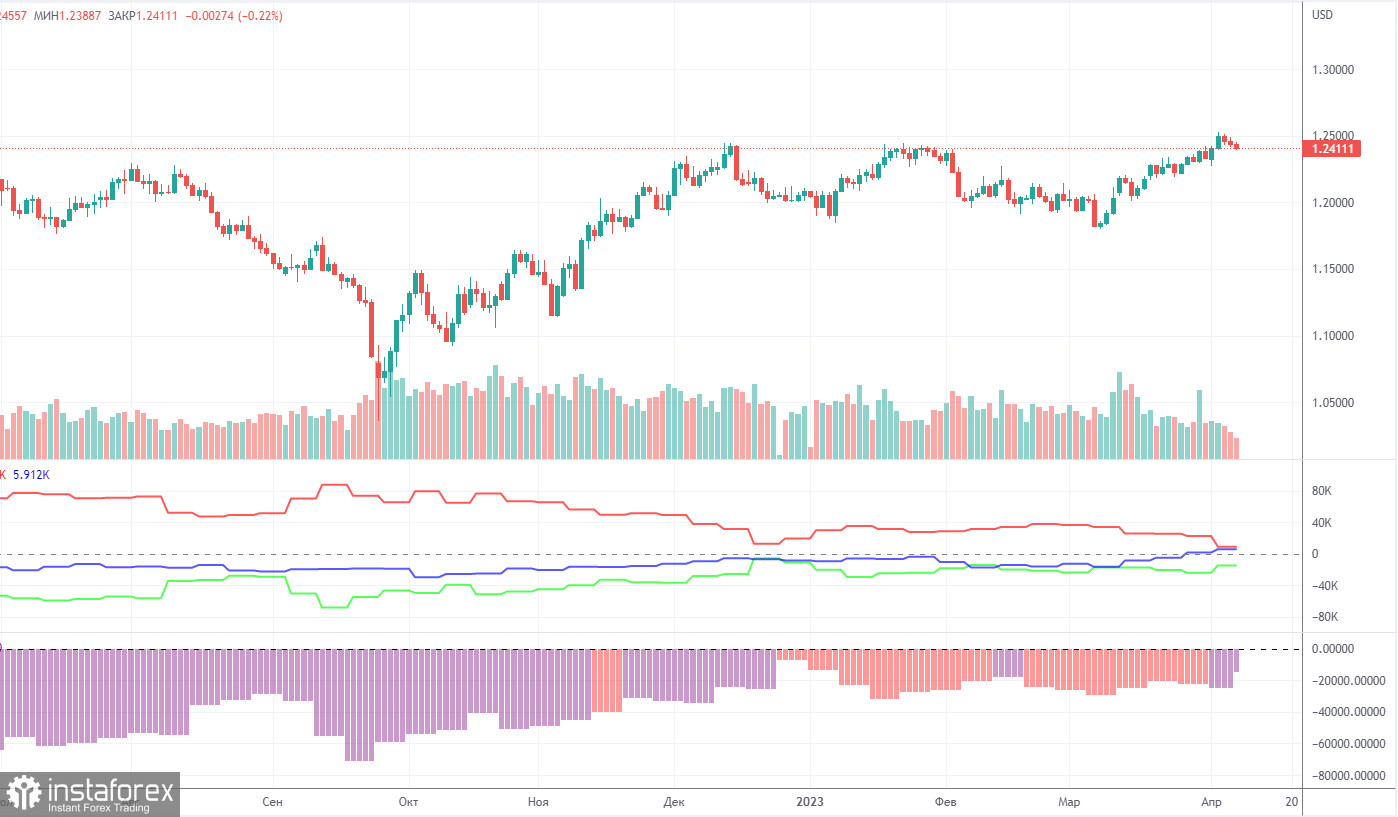
COT report:

COT reports for the British pound are again released in due time. The latest available report is for April 4th. According to this report, the Non-commercial group opened 18,000 long positions and also opened 8,800 short positions. As a result, the net position of non-commercial traders increased by 9,200 and continues to grow. The net position indicator has been steadily growing for the past 7-8 months, but the sentiment of major players remains bearish. Although the pound sterling is growing against the US dollar in the medium term, it is very difficult to figure out the reasons for the sterling's rally from a fundamental point of view. We absolutely do not exclude the scenario in which a sharper drop in the pound will begin in the short term. Formally, it has already started, but so far this movement looks more like a flat market. We also note that both major pairs are currently following roughly the same pattern, but the net position for the euro is positive and even implies a soon-to-be-ending upward impulse, while for the pound, it is negative, which suggests further growth. The British currency has already rallied by 2,100 points. It is stunning growth without a strong downward correction, so a further rally will be absolutely illogical. The non-commercial group now holds a total of 61,000 shorts and 46,000 longs open. We are still skeptical about the long-term uptrend of the British currency and expect it to fall.
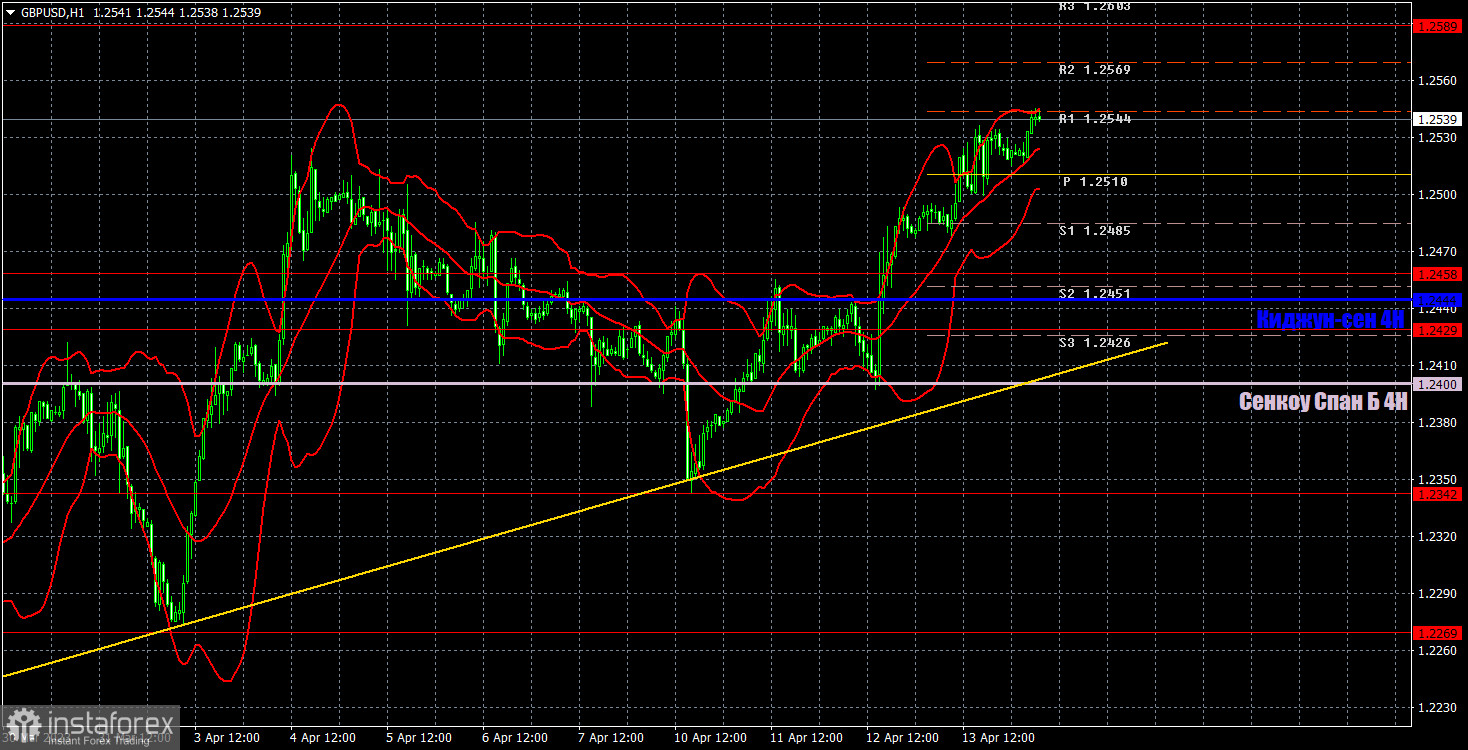
1H chart of GBP/USD

On the one-hour chart, GBP/USD maintains an uptrend, although it has corrected slightly towards the trendline over the past week. The pound doesn't really have enough reasons to justify its growth, but market participants don't really care about that right now. Therefore, the pair may continue to move up for no reason. The price is still above the trendline and above the Senkou Span B line, so technically, there are more chances for the pair to rise. For April 14, we highlight the following important levels: 1.1927, 1.1965, 1.2143, 1.2185, 1.2269, 1.2342, 1.2429-1.2458, 1.2589, 1.2659, 1.2762. Senkou Span B (1.2400) and Kijun-sen (1.2444) lines can also be sources of signals. Rebounds and breakouts from these lines can also serve as trading signals. It is better to set the Stop Loss at breakeven as soon as the price moves by 20 pips in the right direction. The lines of the Ichimoku indicator can change their position throughout the day which is worth keeping in mind when looking for trading signals. On the chart, you can also see support and resistance levels where you can take profit. On Friday, Bank of England representative Silvana Tenreyro is set to deliver a speech, and that will take place closer to the evening. In the US, there are several not-so-important reports, but traders can still use them to sell the dollar and buy the pound.
Indicators on charts:
Resistance/support - thick red lines, near which the trend may stop. They do not make trading signals.
Kijun-sen and Senkou Span B are the Ichimoku indicator lines moved to the hourly timeframe from the 4-hour timeframe. They are also strong lines.
Extreme levels are thin red lines, from which the price used to bounce earlier. They can produce trading signals.
Yellow lines are trend lines, trend channels, and any other technical patterns.
Indicator 1 on the COT chart is the size of the net position of each trader category.
Indicator 2 on the COT chart is the size of the net position for the Non-commercial group of traders.


