


Trend analysis (Fig. 1).
On Friday, the market will try to continue its upward movement from the 1.2518 level (closing of yesterday's daily candle) with the target of 1.2582, the historical resistance level (blue dotted line). Upon reaching this level, a downward pullback is possible.
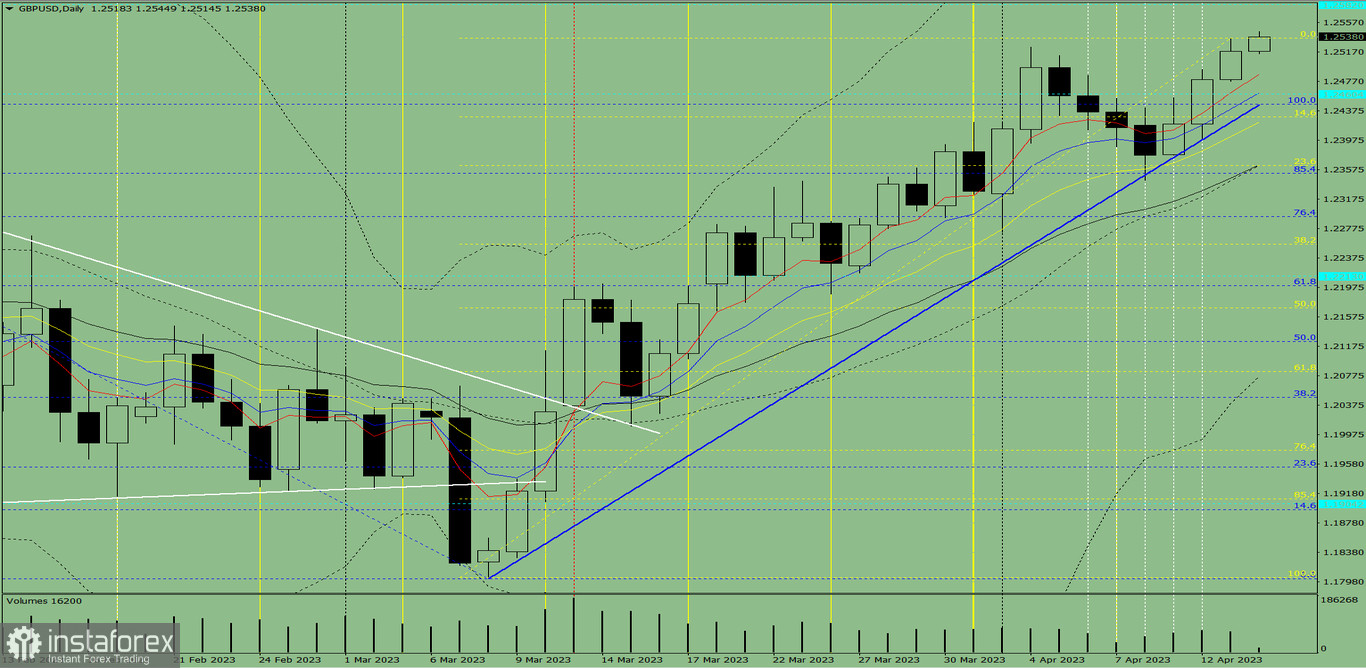
Fig. 1 (daily chart).
Comprehensive analysis:
- Indicator analysis - up;
- Fibonacci levels - up;
- Volumes - up;
- Candlestick analysis - up;
- Trend analysis - up;
- Bollinger bands - up;
- Weekly chart - up.
General conclusion:
Today, the price will try to continue its upward movement from the 1.2518 level (closing of yesterday's daily candle) with the target of 1.2582, the historical resistance level (blue dotted line). Upon reaching this level, a downward pullback is possible.
Alternatively, the price will try to continue its upward movement from the 1.2518 level (closing of yesterday's daily candle) with the target of 1.2536, the upper fractal (yellow dotted line). Upon reaching this level, a downward pullback is possible with the target of 1.2488, the 5-day EMA (thin red line).


