


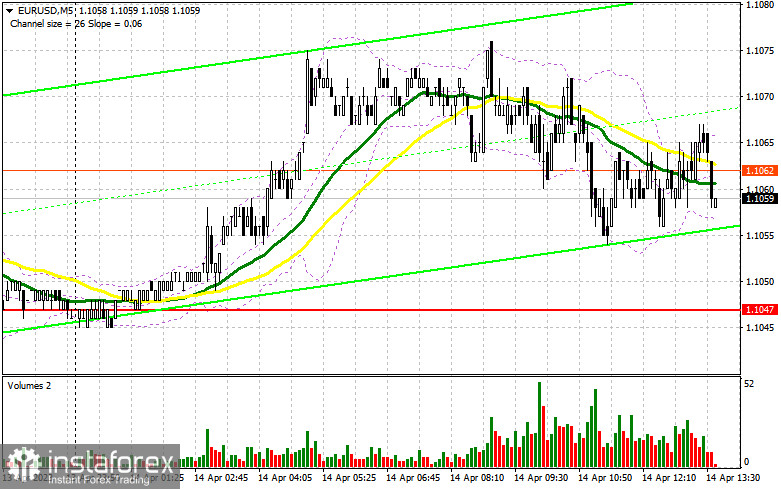
In my morning article, I turned your attention to 1.1047 and recommended making decisions with this level in focus. Now, let's look at the 5-minute chart and figure out what actually happened. Given the low market volatility before the release of crucial US economic reports, the pair failed to reach the target levels. Hence, there were no entry points in the morning. For the American session, the technical outlook has not changed as well as the strategy.
When to open long positions on EUR/USD:
In the afternoon, the US will reveal retail sales and industrial production data. Retail sales are expected to fall which may put pressure on the US dollar again. The speech of Fed policymaker Christopher Waller is unlikely to have much impact on the market. Traders are now focused on the Consumer Sentiment Index and inflation expectations from the University of Michigan. I would advise you to trade according to the morning scenario. A false breakout of 1.1047 will give a buy signal with the prospect of a rise to a new monthly high of 1.1089. The pair failed to reach this level in the morning. A breakout and downward retest of this level amid weak retail sales in the United States will boost the bullish bias. It could provide an additional entry point into long positions with a jump to the resistance level of 1.1125. A more distant target will be the level of 1.1174 where I recommend locking in profits. If EUR/USD declines and buyers show no activity at 1.1047, which looks possible as traders usually lock in profits at the end of the week, the pressure on the euro will increase. The pair may return to 1.1011, where the moving averages are benefiting the bulls. Only a false breakout there will give a buy signal. You could buy EUR/USD at a bounce from 1.0972, keeping in mind an upward intraday correction of 30-35 pips.
When to open short positions on EUR/USD:
Bears are unable to regain the upper hand as the pair is now trading at highs. Low volatility only indicates that bulls are now waiting for US economic data. In case of further EUR/USD rise in the afternoon after weak US statistics, they need to protect 1.1089. At this level, there could be a false breakout, which may lead to a decrease to the support level of 1.1047. Bulls and bears are sure to tussle for this level. As I have mentioned earlier, this level is crucial in the short term as its breakout and an upward retest will increase the pressure on the euro. It could trigger a downward correction and push EUR/USD to 1.1011. After a drop below this level, the pair may sink to 1.0972 where I recommend locking in profits. If EUR/USD rises during the American session and bears show no energy at 1.1089, which is more likely, especially in such a bull market, I would advise you to postpone short positions until a false breakout of 1.1125. You could sell EUR/USD at a bounce from 1.1174, keeping in mind a downward intraday correction of 30-35 pips.
COT report
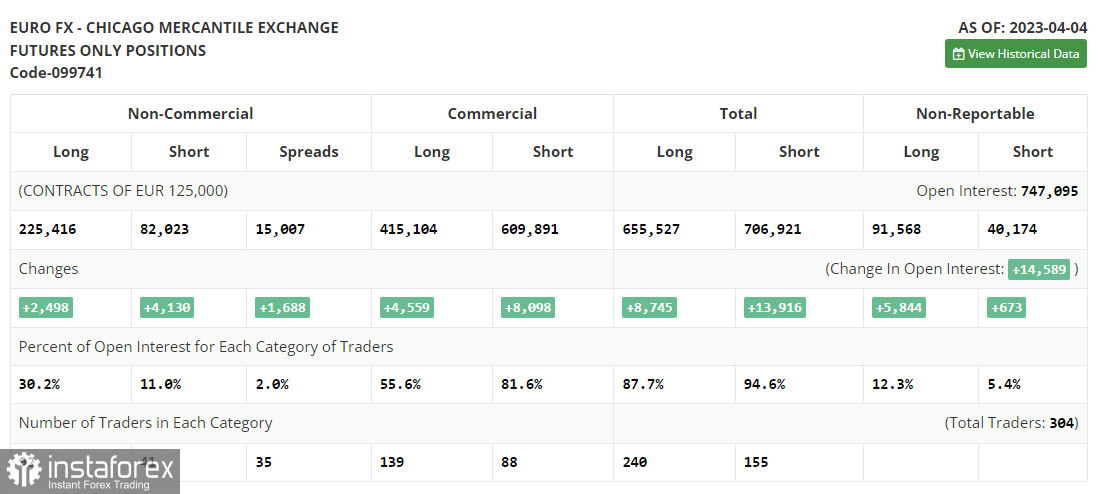
The COT report (Commitment of Traders) for April 4 logged growth in both long and short positions. Nothing interesting happened last week because the US nonfarm payrolls didn't come as a bombshell. Now buyers of risky assets, including the euro, are looking forward to crucial economic data such as US inflation data and retail sales for March. The FOMC's March meeting minutes will also matter a lot to market sentiment. If all this indicates the need for further interest rate hikes, the US dollar may recoup some of the losses incurred last month. However, if in the macroeconomic data and the minutes, investors discover the signs that the US Fed could moderate its aggressive monetary tightening, the euro will have arguments to cement its growth. The COT report states that non-commercial long positions increased by 2,498 to 225,416, while non-commercial short positions jumped by 4,130 to 82,023. As a result of the week, the overall non-commercial net position decreased and amounted to 143,393 against 145,025. EUR/USD closed last week higher at 1.1 against 1.0896 a week ago.
Indicators' signals:
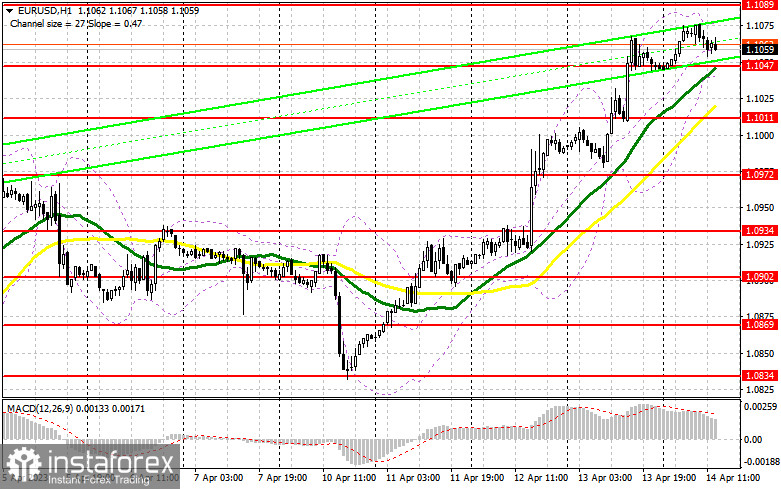
Trading is carried out above the 30 and 50 daily moving averages, which indicates a further upward movement of the euro.
Moving averages
Note: The period and prices of moving averages are considered by the author on the H1 (1-hour) chart and differ from the general definition of the classic daily moving averages on the daily D1 chart.
Bollinger Bands
If EUR/USD declines, the indicator's lower border at 1.0945 will serve as support.
Description of indicators
- Moving average (moving average, determines the current trend by smoothing out volatility and noise). Period 50. It is marked yellow on the chart.
- Moving average (moving average, determines the current trend by smoothing out volatility and noise). Period 30. It is marked green on the chart.
- MACD indicator (Moving Average Convergence/Divergence - convergence/divergence of moving averages) Quick EMA period 12. Slow EMA period to 26. SMA period 9
- Bollinger Bands (Bollinger Bands). Period 20
- Non-commercial speculative traders, such as individual traders, hedge funds, and large institutions that use the futures market for speculative purposes and meet certain requirements.
- Long non-commercial positions represent the total long open position of non-commercial traders.
- Short non-commercial positions represent the total short open position of non-commercial traders.
- Total non-commercial net position is the difference between the short and long positions of non-commercial traders.


