


5M chart of EUR/USD

On Friday, EUR/USD stood still in the middle of the day. There was no macroeconomic data or fundamental background either. Several data started to be released during the US session, which could hardly be interpreted unequivocally in favor of the dollar. However, at the same time, Christopher Waller of the Federal Reserve spoke, indicating that the central bank is not yet finished with tightening monetary policy, and inflation is still at a too high level. This statement provoked the strengthening of the US currency, although we had no doubt that the Fed would continue to raise rates. Now the main thing is for the bears to pick up the emerging trend.
There was only one trading signal. At the beginning of the US trading session, the price broke through the 1.1036 level, afterwards it went down at least 50 points. It didn't reach the critical line, but traders could still make about 40 points profit on this trade, since the effect of the pullback was minimal. Now the dollar needs to overcome the Ichimoku indicator lines if it wants to finally start growing.
COT report:
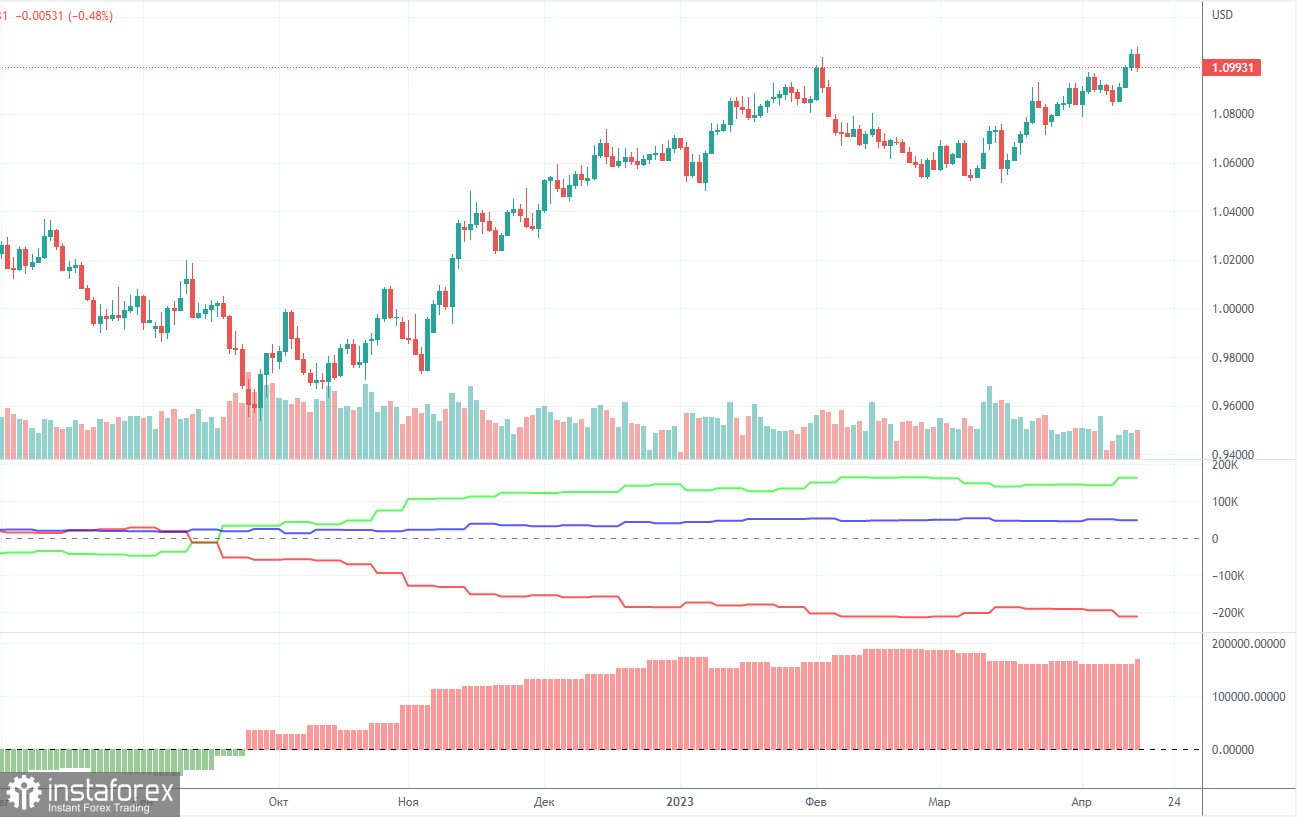
On Friday, a new COT report for April 11th was released. The CFTC has caught up with the lost time and now publishes reports that correspond to the current time period. In the past few months, the picture has been entirely consistent with what has been happening in the market. The picture above clearly shows that the net position of major players (the second indicator) has been growing since the beginning of September 2022. At the same time, the European currency also began to rise. At the moment, the net position of non-commercial traders remains bullish and very high, as does the position of the European currency, which cannot even properly correct downward. Importantly, a relatively high "net position" value suggests the scenario that an uptrend will be over soon. This is signaled by the first indicator, where the red and green lines have moved far apart from each other, which often prefaces the end of a trend. The European currency tried to go down, but we have only seen a minor downward retracement so far. During the last reporting week, the number of long positions among the non-commercial group increased by 18,700, while the number of short contracts fell by 1,200. Accordingly, the net position has increased significantly. The number of long positions is higher than the number of shorts among non-commercial traders by 164,000. A correction is still on the horizon, so even without COT reports, it is clear that EUR/USD should resume its decline.
1H chart of EUR/USD
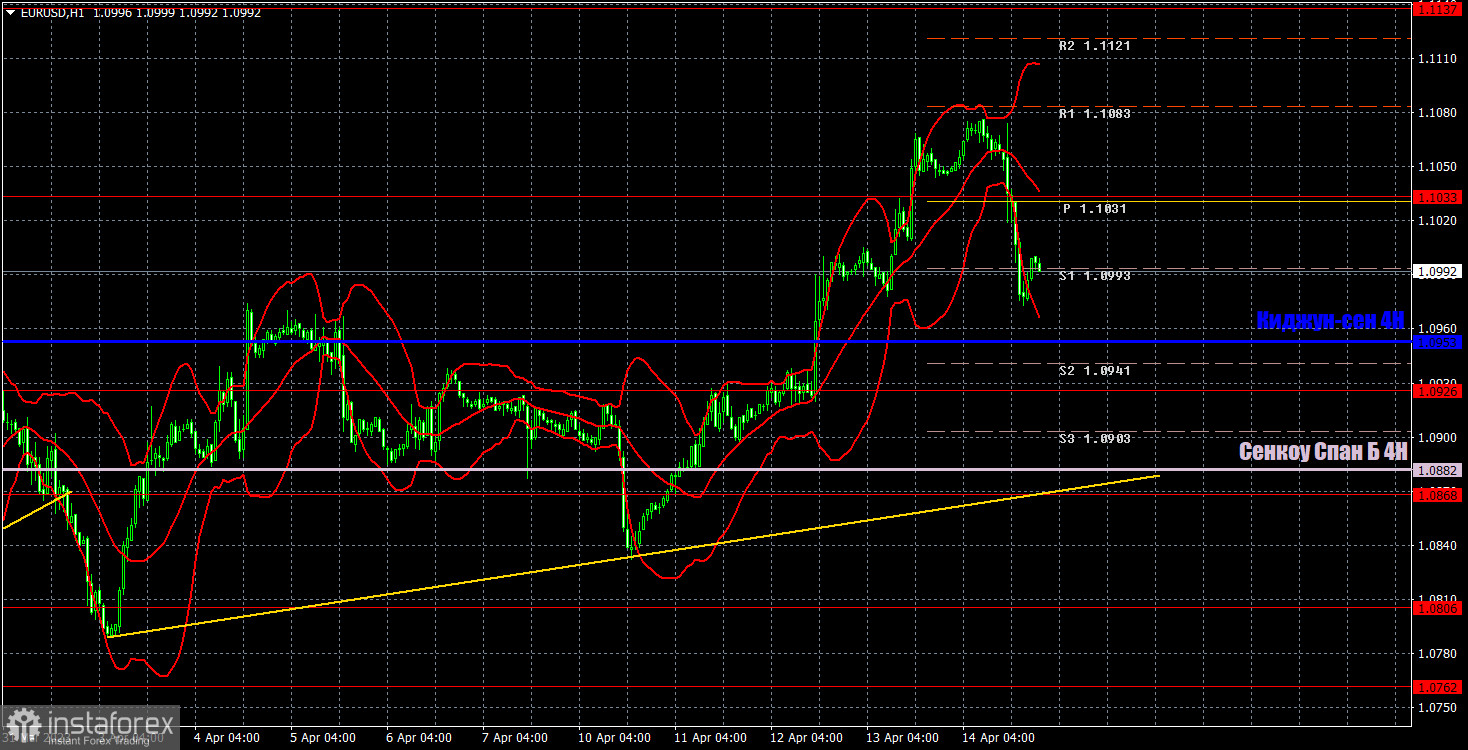
On the hourly chart, the pair maintains an uptrend, as shown by the fact that it is staying above the trend line and above all lines of the Ichimoku indicator. Even despite a fairly strong pullback on Friday, nothing has changed technically so far. The dollar finds it difficult to rise, which is very strange and surprising, since there are no strong grounds for the euro to grow. For Monday, we highlight the following trading levels - 1.0658-1.0669, 1.0762, 1.0806, 1.0868, 1.0926, 1.1033, 1.1137-1.1185, 1.1234, 1.1274, as well as Senkou Span B (1.0882) and Kijun-sen (1.0953) lines. Ichimoku indicator lines can move intraday, which should be taken into account when determining trading signals. There are also support and resistance although no signals are made near these levels. They could be made when the price either breaks or rebounds from these extreme levels. Do not forget to place Stop Loss at the breakeven point when the price goes by 15 pips in the right direction. In case of a false breakout, it could save you from possible losses. On April 17th in the European Union, European Central Bank President Christine Lagarde is set to deliver a speech, and this is the key and only event of the day. However, everything will depend on what exactly Lagarde says. Therefore, during her speech, we need to be prepared in case we witness a sharp change in direction, but don't expect it to be inevitable. The market can still interpret any event in favor of the euro or just buy the pair for no reason.
Indicators on charts:
Resistance/support - thick red lines, near which the trend may stop. They do not make trading signals.
Kijun-sen and Senkou Span B are the Ichimoku indicator lines moved to the hourly timeframe from the 4-hour timeframe. They are also strong lines.
Extreme levels are thin red lines, from which the price used to bounce earlier. They can produce trading signals.
Yellow lines are trend lines, trend channels, and any other technical patterns.
Indicator 1 on the COT chart is the size of the net position of each trader category.
Indicator 2 on the COT chart is the size of the net position for the Non-commercial group of traders.


