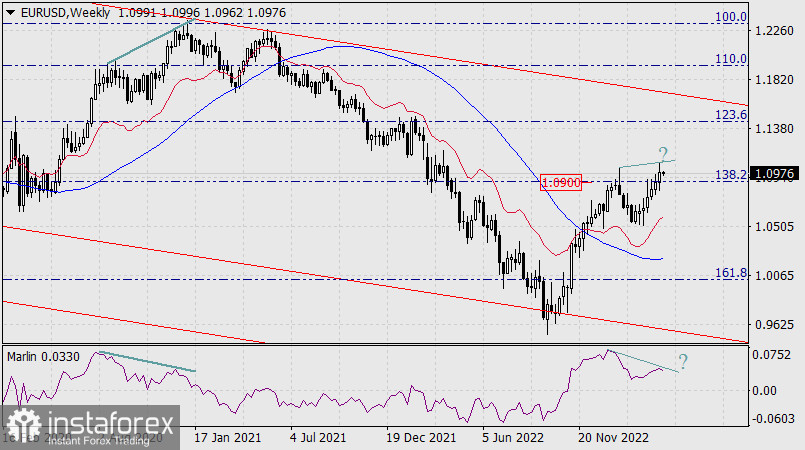
On the weekly chart, the price is starting to form a reversal divergence with the Marlin oscillator from the long-lasting correction from October 2022.

The last time a divergence of this quality was formed was in September-December 2020 (thick lines on the chart). Consolidating the weekly candlestick below the Fibonacci level of 138.2% (1.0900) will confirm the price's return to a downtrend in the long-term.

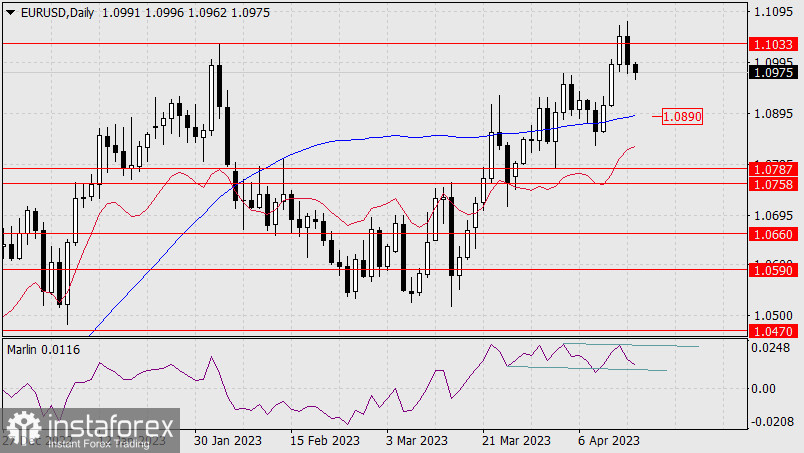
On the daily chart, the price has returned below the control-target level of 1.1033 with a clear intention to reach the support of the MACD indicator line (1.0890). Consolidation below it opens the target range of 1.0758/87.
Here we also see a divergence, but there is a technical and graphical nuance – this reversal may be in the structure of the inclined consolidation, formed by its turquoise lines, which may be a preparation for a sideways or wedge-shaped form – a more complex reversal. Consolidating below the MACD line, below the 1.0890 mark, will neutralize such options.

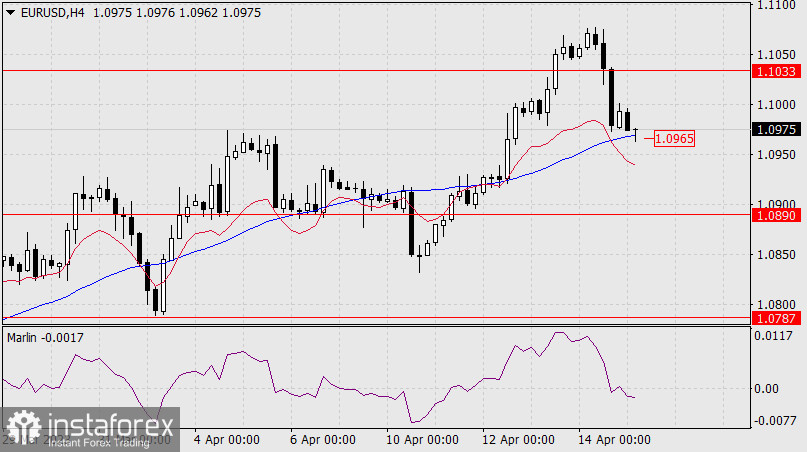
On the four-hour chart, the price is attacking the support of the MACD line. Consolidating below it (below 1.0965) can push the price to 1.0890. The Marlin oscillator has settled in the "red". I expect the bears to succeed.


