


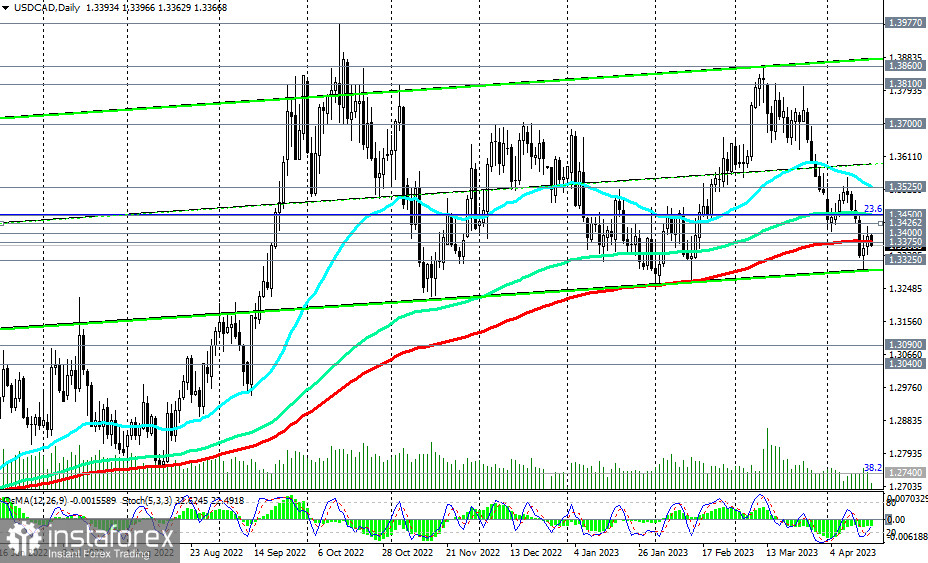
Overall, the long-term upward dynamics of USD/CAD persist, and the breakout of the 1.3450 resistance level (144 EMA on the daily chart and the 23.6% Fibonacci retracement level in the last strongest wave of growth from 0.9700 to 1.4600) will again bring the pair into the zone of a medium-term bullish market with the nearest target at the 1.3525 resistance level (50 EMA on the daily chart). The first signal for resuming long positions in the pair will be the breakout of resistance levels 1.3400, 1.3426 (200 EMA on the 1-hour chart).
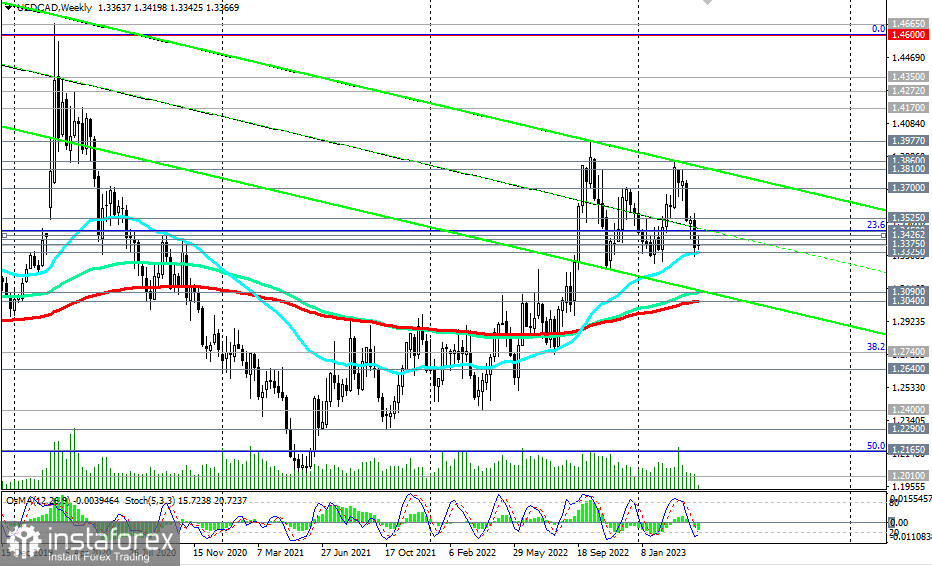
In an alternative scenario, and after the retest of the 1.3325 support level (50 EMA on the weekly chart), USD/CAD will continue to decline towards the key support levels 1.3090 (144 EMA on the weekly chart), 1.3040 (200 EMA on the weekly chart). Above these levels, USD/CAD is trading in the long-term bullish market zone. Thus, above the support levels 1.3325, 1.3300, long positions remain preferable despite the current downward correction.
As for the main news of the day concerning the USD/CAD pair, pay attention to the publication of important macro data for Canada and the U.S. at 12:30 (GMT) and the speech of Bank of Canada Governor Tiff Macklem at 15:30.
Support levels: 1.3375, 1.3325, 1.3300, 1.3200, 1.3090, 1.3040
Resistance levels: 1.3400, 1.3426, 1.3450, 1.3525, 1.3600, 1.3700, 1.3810, 1.3860, 1.3900, 1.3970, 1.4000


