


Trend analysis (Fig. 1).
The market may move downward from the level of 1.0971 (closing of yesterday's daily candle) with the target at 1.0937, the 23.6% pullback level (yellow dotted line). Upon reaching this level, a continued downward movement is possible with the target of 1.0857, the 38.2% pullback level (yellow dotted line). From this level, the price may move up.
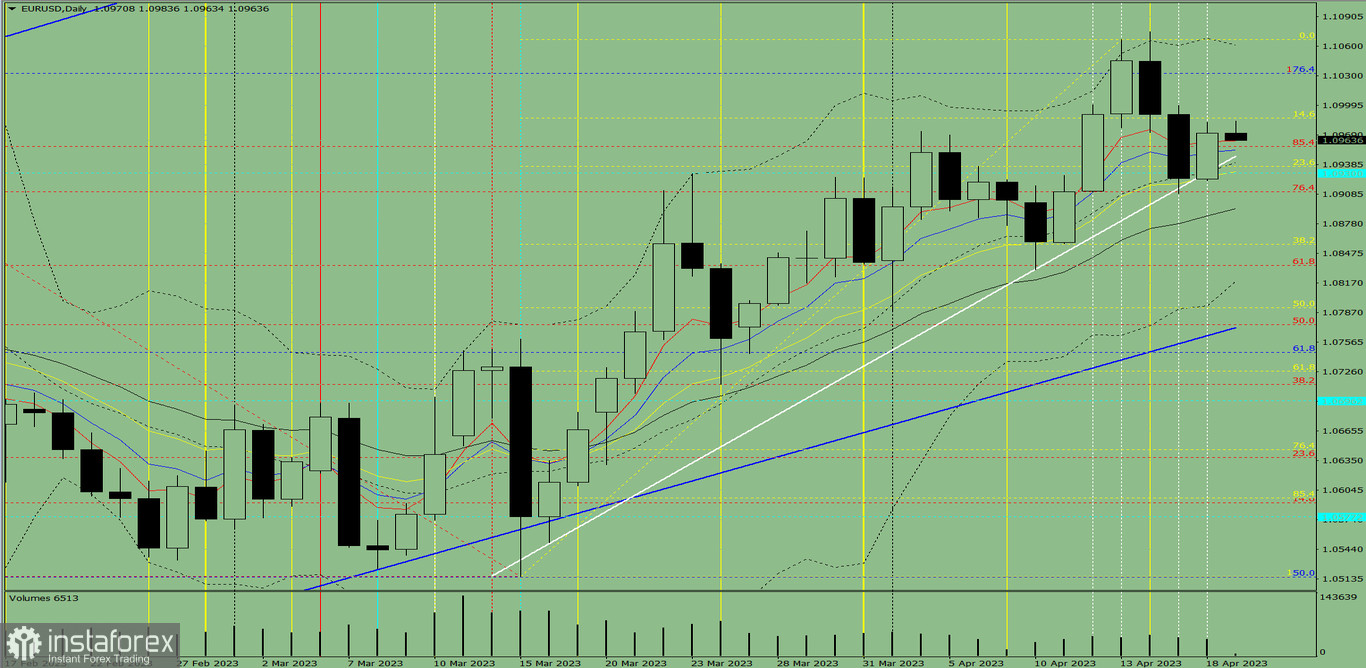
Fig. 1 (daily chart).
Comprehensive analysis:
- Indicator analysis - down;
- Fibonacci levels - down;
- Volumes - down;
- Candlestick analysis - down;
- Trend analysis - up;
- Bollinger bands - up;
- Weekly chart - down.
General conclusion:
Today, the price may move downward from the level of 1.0971 (closing of yesterday's daily candle) with the target at 1.0937, the 23.6% pullback level (yellow dotted line). Upon reaching this level, a continued downward movement is possible with the target of 1.0857, the 38.2% pullback level (yellow dotted line). From this level, the price may move up.
Alternatively, the price may move downward from the level of 1.0971 (closing of yesterday's daily candle) with the target at 1.0911, the 76.4% pullback level (red dotted line). Upon reaching this level, an upward movement is possible with the target at 1.0986, the 14.6% pullback level (yellow dotted line).


