


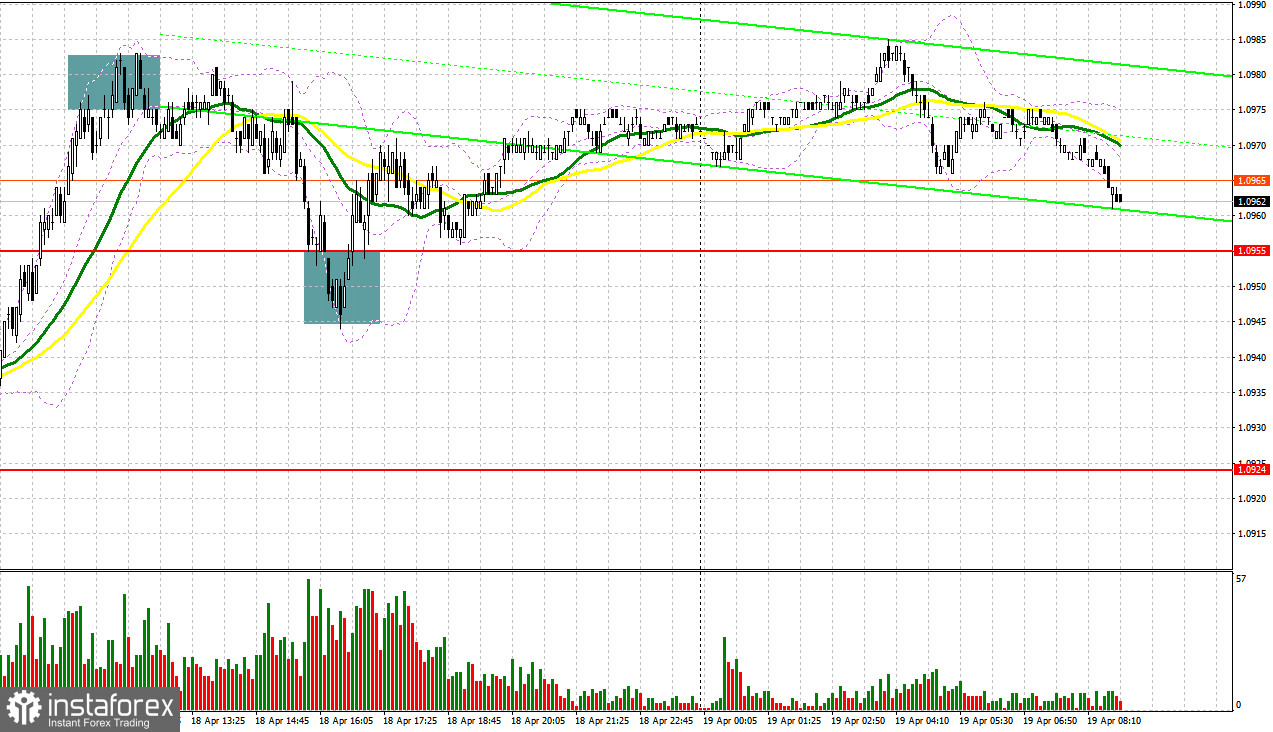
Yesterday, the pair formed several signals to enter the market. Let's have a look at the 5-minute chart and see what happened there. In my morning forecast, I drew attention to the 1.0983 level and recommended making market entry decisions from there. A rise and formation of a false breakout at 1.0983 led to a sell signal for the euro. However, there was no quick or significant downward movement. It was only closer to the second half of the day that the pair dipped to around 1.0955. An unsuccessful attempt to break lower generated a buy signal in line with the developing trend. As a result, the euro advanced by approximately 20 pips.
To open long positions on EUR/USD:
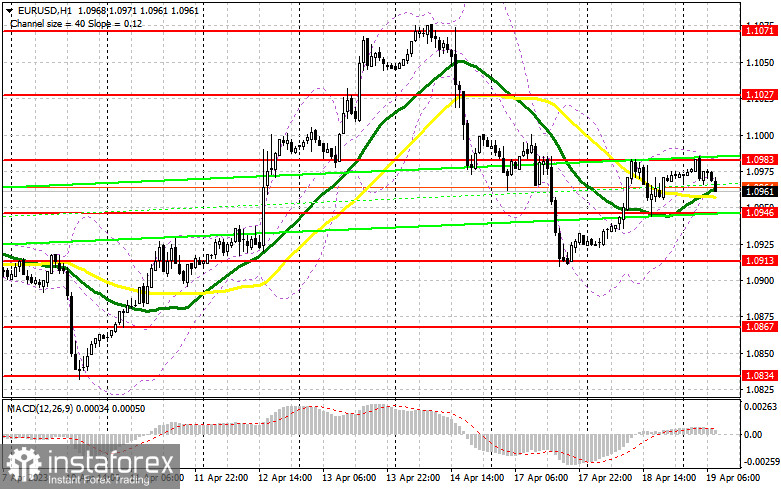
US real estate market data turned out to be rather mixed, allowing euro buyers to maintain their initiative yesterday. Today, the market may also remain on the side of buyers as important reports are expected on the European Central Bank's (ECB) current account balance and the Eurozone Consumer Price Index (CPI) for March. If inflation does not decrease for some reason, the euro is likely to stay in demand as it would be further evidence of the ECB's aggressive policy. In this case, it is essential to pay close attention to speeches by ECB Executive Board members Philip Lane and Isabel Schnabel. If inflation decreases, demand for the euro may weaken, pushing EUR/USD down to the nearest support level of 1.0946. The formation of a false breakout at this level will lead to a buy signal and a rise to the nearest resistance of 1.0983, which was formed yesterday. A breakout and a downward test of this range will boost buyers' confidence, returning the uptrend and creating an additional entry point for adding long positions with the next resistance at 1.1027. The ultimate target remains the 1.1071 area where I will take profit. If EUR/USD declines and bulls are idle at 1.0946, which may occur in the first half of the day, pressure on the euro will increase, and we will see a new downward movement to 1.0913. Only the formation of a false breakout there will provide a buy signal for the euro. I will open long positions immediately on the rebound from the low of 1.0867, keeping in mind an intraday upward correction of 30-35 pips.
To open short positions on EUR/USD:
Sellers retreated yesterday and their last hope today is to reach the new resistance at 1.0983. A negative reaction to inflation in the eurozone and a false breakout at this level will generate a sell signal which can bring the pair back to 1.0946. Slightly above this level, moving averages play on the side of the buyers, so the bears may have difficulties. Consolidation below this range, as well as upward retest, will pave the way to 1.0913. The furthest target will be a new weekly low at 1.0867 where I will take profit. If EUR/USD moves higher during the European session and there are no bears at 1.1001, which is more likely, especially if inflation in the eurozone suddenly rises, I would advise you to wait until the price hits the level of 1.1027. You can sell at this range only if the price fails to settle there. I will open short positions immediately on a rebound from the high of 1.1071 with the aim of a downward correction of 30-35 pips.
COT report:
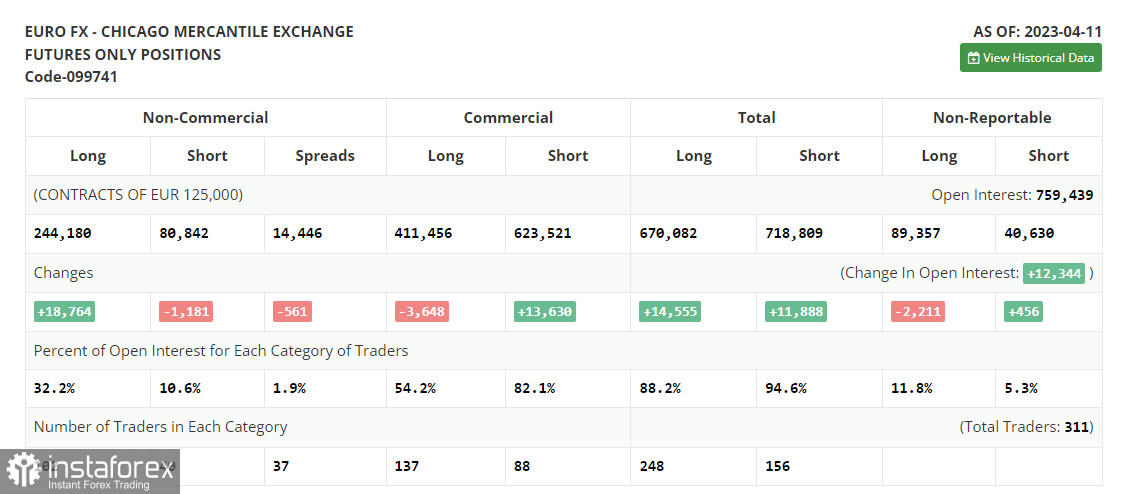
The Commitments of Traders report for April 11 recorded a rise in long positions and a drop in short ones. Recent US statistics signal a gradual overheating of the labor market, as well as a reduction in retail sales, which will definitely have a positive effect on inflationary pressures in the US. This may allow the Federal Reserve to stop its tightening cycle. But according to the minutes of the last meeting, Fed officials do not intend to do this right now. Most likely, we will see another rate hike of 0.25% in May this year. If so, the US dollar will maintain its leading position against the euro, trading below 1.1000. There is no crucial data this week apart from business activity in the private and industrial sectors. So, the euro sellers will have every chance for a continuation of the downward correction. The COT report indicates that long non-commercial positions increased by 18,764 to 244,180, while short non-commercial positions decreased by 1,181 to 80,842. At the end of the week, the total non-commercial net position fell to 162,496 from 143,393. The weekly closing price declined to 1.0950 from 1.1.
Indicator signals:
Moving Averages
Trading above the 30- and 50-day moving averages indicates a further rise in the euro.
Please note that the time period and levels of the moving averages are analyzed only for the H1 chart, which differs from the general definition of the classic daily moving averages on the D1 chart.
Bollinger Bands
If the pair declines, the lower band of the indicator at 1.0960 will serve as support.
Description of indicators:
• A moving average of a 50-day period determines the current trend by smoothing volatility and noise; marked in yellow on the chart;
• A moving average of a 30-day period determines the current trend by smoothing volatility and noise; marked in green on the chart;
• MACD Indicator (Moving Average Convergence/Divergence) Fast EMA with a 12-day period; Slow EMA with a 26-day period. SMA with a 9-day period;
• Bollinger Bands: 20-day period;
• Non-commercial traders are speculators such as individual traders, hedge funds, and large institutions who use the futures market for speculative purposes and meet certain requirements;
• Long non-commercial positions represent the total number of long positions opened by non-commercial traders;
• Short non-commercial positions represent the total number of short positions opened by non-commercial traders;
• The non-commercial net position is the difference between short and long positions of non-commercial traders.


