


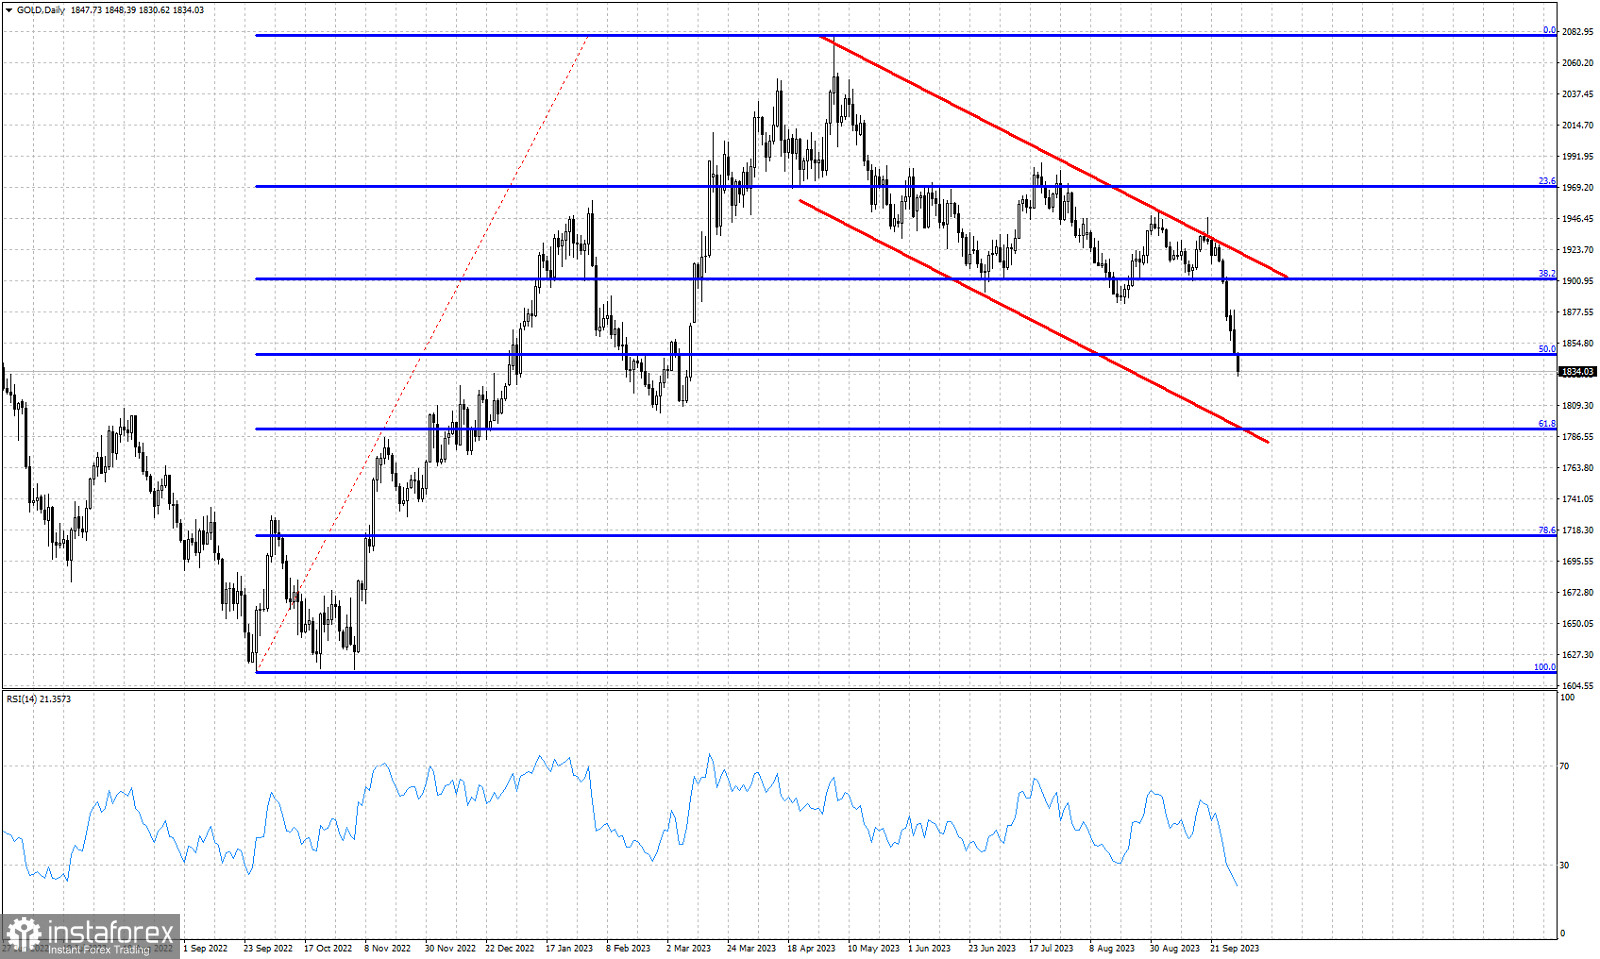
Blue lines -Fibonacci retracement levels
Red lines- bearish channel
Gold price is trading around $1,834. Gold remains in a short-term bearish trend making lower lows and lower highs. Price has broken below the 50% Fibonacci retracement and the RSI is in oversold territory and new lows in the Daily chart. Bears remain in full control of the near term trend. Price continues to trade inside the red downward sloping channel. Gold price remains under pressure but we believe there should be a counter trend bounce this week. The chances for such a bounce have increased but so far we have no indication of a coming reversal. At $1,792 we find the 61.8% Fibonacci retracement of the entire upward move from the 2022 lows. This is very important Fibonacci support. Bulls do not want to see this level broken. In the near term I expect Gold price to bounce. A bounce with a lower high will give me the 61.8% retracement as the next target.


