


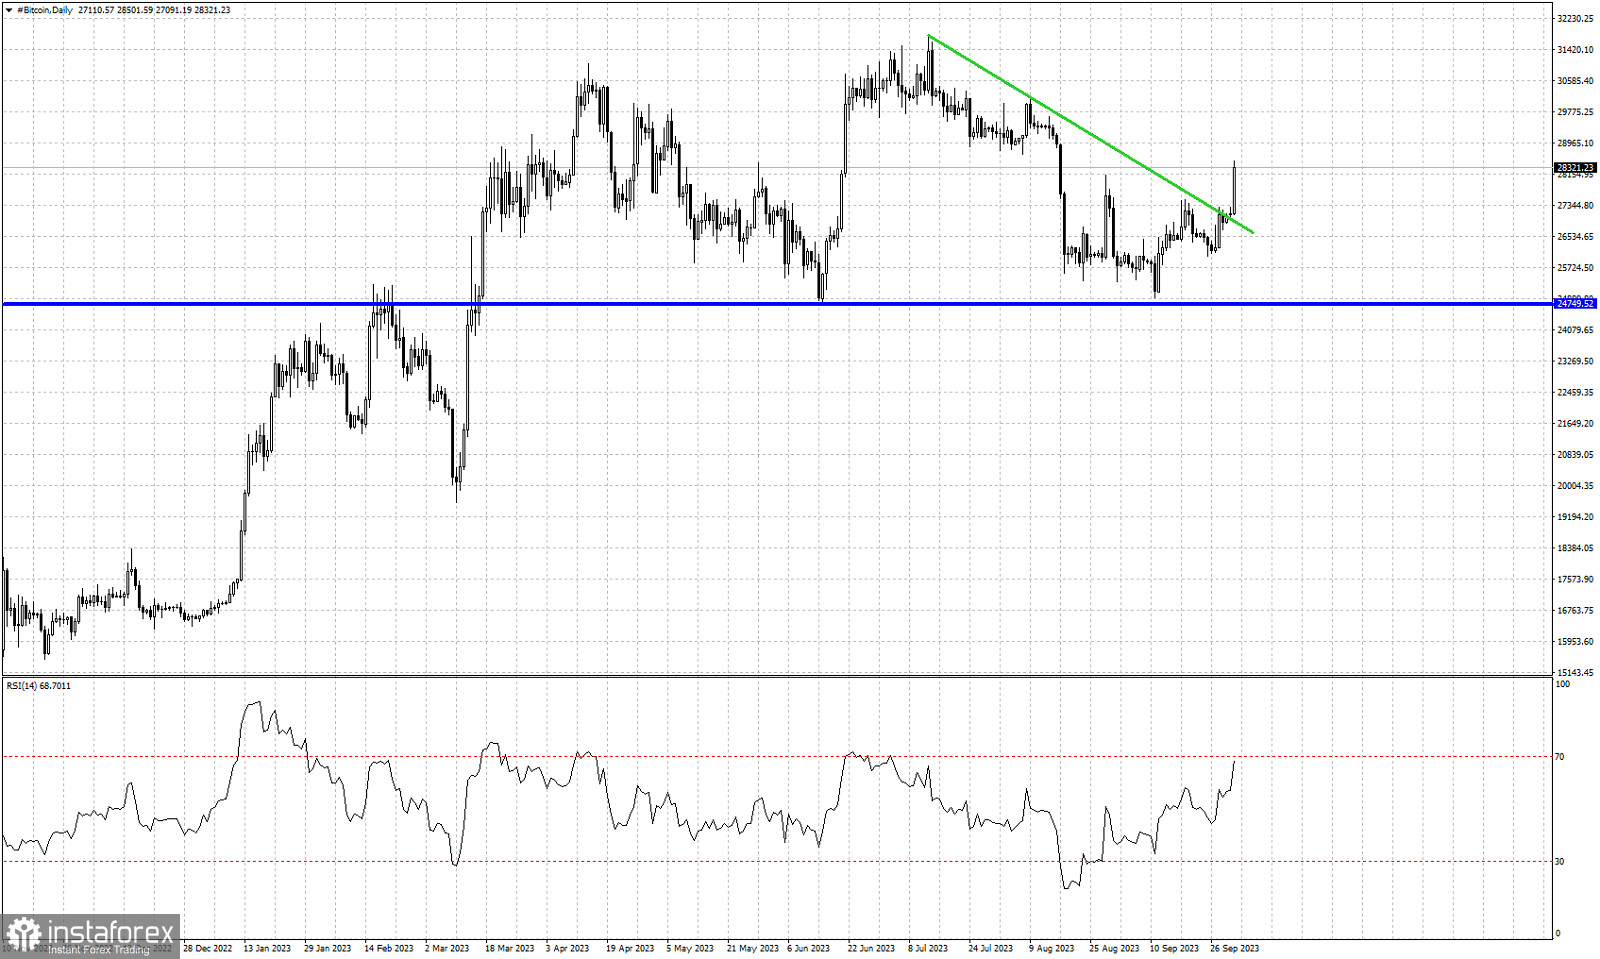
Green line- resistance trend line
Blue line- horizontal support
Bitcoin is trading around $28,450. Bitcoin has broken today above the green resistance trend line. Price recently tested the horizontal support at $24,750 and price is now bouncing higher. Price has started making higher highs and higher lows in the near term. Respecting the blue horizontal support was a very important sign. The bullish trend remains supported. As long as price is holding above the blue support line, Bitcoin could produce a new higher high towards $32,000 and higher. Short-term support is now found at $26,000. Bulls do not want to see price break below this level. If this level is broken downwards, Bitcoin should then fall towards $24,750 for a strong test. On the other hand bears would like to see Bitcoin price form a lower high and then turn lower for a break below $24,750 towards $20,000 and lower. For the time being bulls have the upper hand as long as $26,000 and $24,750 hold.


