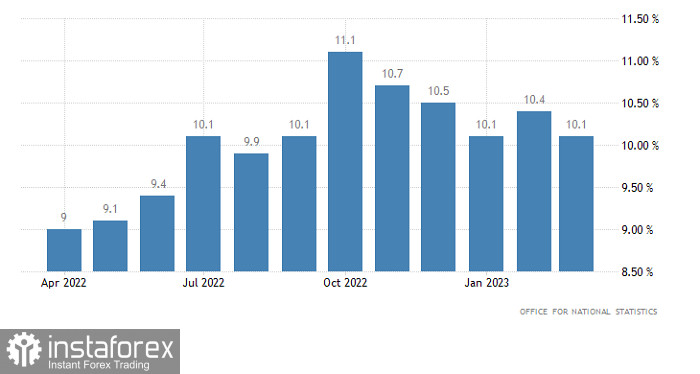
In regards to the Bank of England, everything is quite clear, and it will continue to raise interest rates as inflation in the UK has slowed from 10.4% to 10.1%. Although this is slightly below the forecast of 10.2%, inflation remains extremely high. Therefore, the British central bank has no other choice but to continue tightening monetary policy. However, there is nothing unexpected or new about this. We already knew about it even before the inflation report was published. So, although the pound jumped back and forth, it essentially remained in place.
Inflation (United Kingdom):

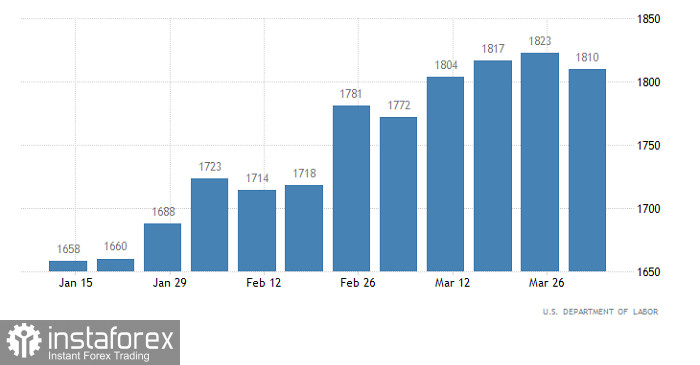
Maybe the US jobless claims report could somewhat revive the market. Moreover, the total number of claims is expected to increase by 10,000. According to forecasts, the number of both initial and continuing unemployment benefit claims may increase by 5,000. The changes may seem insignificant, but it does imply some deterioration in the labor market situation, which should, of course, somewhat weaken the dollar's position.
Number of continuing unemployment benefit claims (United States):

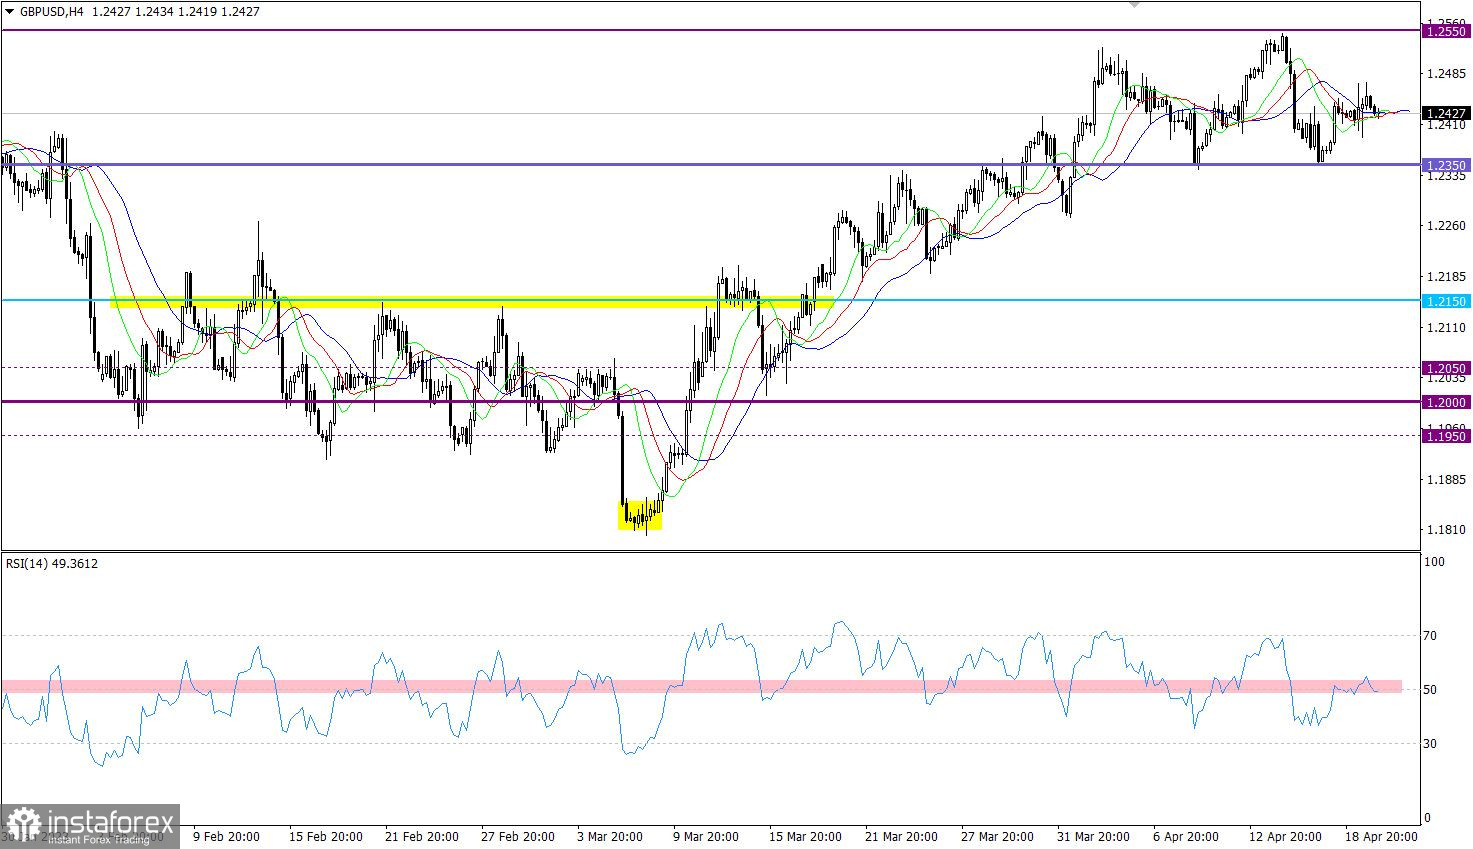
GBP/USD is in a stage of short-term stagnation, which is within the two-week sideways range of 1.2350/1.2550.
On the four-hour chart, the RSI technical indicator is moving along the midline 50, indicating stagnation. In the daily period, the RSI is moving in the upper area, indicating an uptrend in the mid-term.
On the four-hour chart, the Alligator's MAs have multiple intersections with each other, which corresponds to a signal of stagnation. On the daily chart, it reflects a bullish cycle.

Outlook
In this situation, the stagnation along the value of 1.2430 will end shortly. From a technical perspective, the current stop can be classified as a process of accumulating trading forces, in which an outgoing cycle can be expected. However, the main range is considered to be 1.2350/1.2550. Thus, the end of the short-term stagnation will lead the quote to one of the limits of the main flat, depending on the direction of the outgoing momentum.
In terms of the complex indicator analysis, we see that in the short-term and intraday periods, technical indicators are pointing towards different directions due to the stagnation. Meanwhile, in the mid-term period, the indicators are reflecting an upward cycle.


