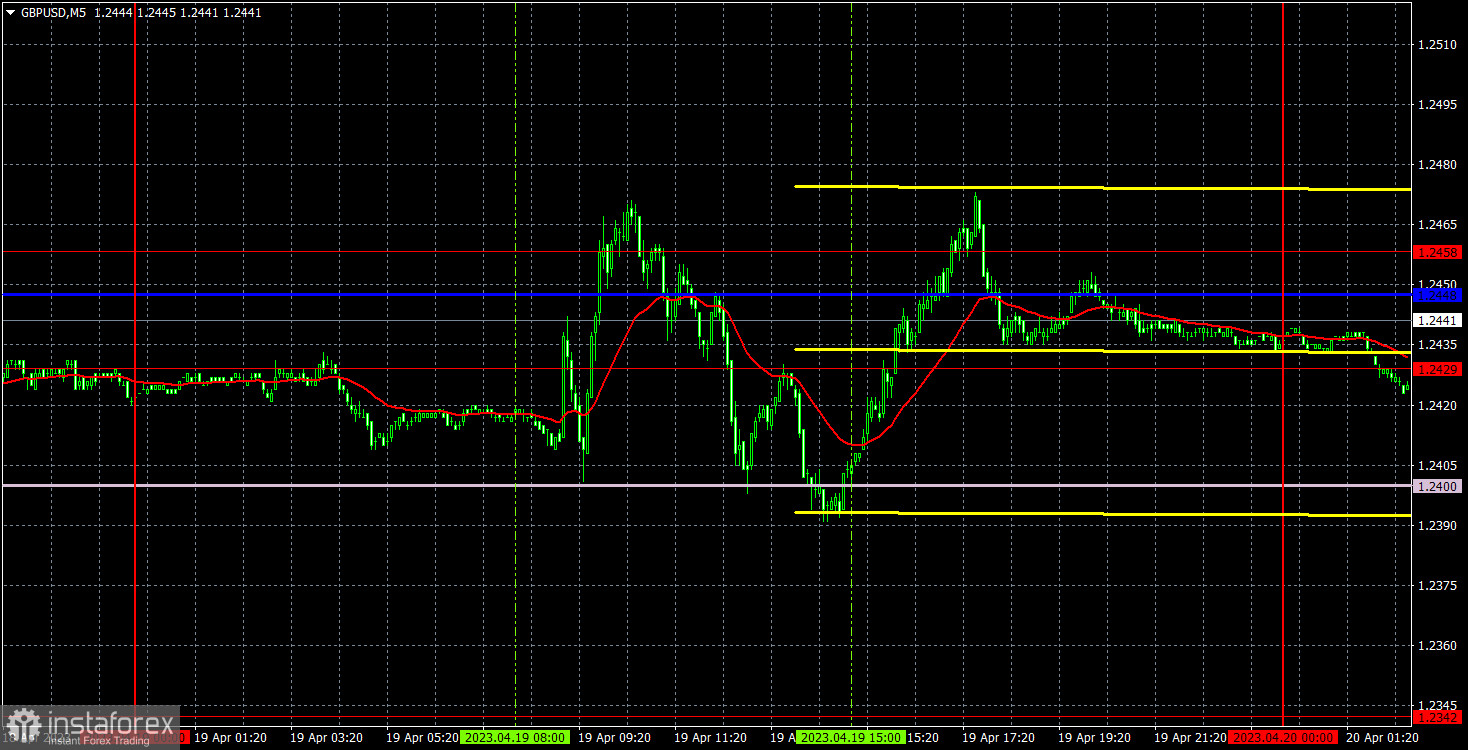
GBP/USD 5M analysis.

On Wednesday, the GBP/USD currency pair also traded flat, although it had more reason to show a trending movement. While the European currency steadily decreased and showed a similar growth spiral, the pound had a substantial ride on the "swings" throughout the day. Of course, such price jumps were related only to one event – the inflation report for the UK in March, which turned out to be unexpected and resonant. Inflation fell sharply in March in the US and the European Union, so a similar trend was expected from the UK. However, the consumer price index only fell by 0.3% and remained above 10%. Thus, the Bank of England is still losing the battle against high price growth "in one goal" despite 11 key rate hikes. The pound did not rise because a weak drop in inflation does not now mean additional monetary policy tightening. But why the pound didn't fall again is a big question.
It makes little sense to analyze yesterday's trade signals, as the pair traded in a sideways channel throughout the day, limited by the Senkou Span B line and the 1.2458 level. The critical line and the 1.2429 level were also located between these landmarks. Therefore, even trading on a rebound from channel boundaries was impossible, as all levels and lines were too close to each other.
COT Report:
According to the latest report on the British pound, the "non-commercial" group opened 8.5 thousand buy contracts and closed 3.8 thousand sell contracts. Thus, the net position of non-commercial traders increased by 12.3 thousand and continues to grow. The net position indicator has steadily grown for 8-9 months. However, the sentiment of major players remains "bearish," and the pound sterling, although growing against the dollar (in the medium term), is very difficult to explain from a fundamental point of view. We do not exclude the possibility that a stronger pound drop will begin in the near future. Both major pairs are moving roughly the same now. Still, the net position for the euro is positive and already implies the completion of the ascending impulse, while for the pound, it is negative, allowing for further growth. The British currency has already risen by more than 2100 points, which is a lot, and without a strong downward correction, further growth will be illogical. The "non-commercial" group now has 57 thousand sell contracts and 55 thousand buy contracts open. We remain skeptical about the long-term growth of the British currency and expect its decline.
GBP/USD 1H analysis.
On the hourly timeframe, the pound/dollar pair began to decline, overcame important lines, and again began to lean towards growth. Flat trading has added to all the problems in the last few days. Formally, the trend has changed to a downward one, and traders are now entitled to expect the formation of a downward trend. However, without breaking the 1.2349 level, no movement to the south will exist. The pound may enter a "swing" mode between levels 1.2349 and 1.2520. It is already obvious that it trades strictly between them. For April 20th, we highlight the following important levels: 1.1927, 1.1965, 1.2143, 1.2185, 1.2269, 1.2349, 1.2429-1.2458, 1.2520, 1.2589, 1.2659, 1.2762. Senkou Span B (1.2400) and Kijun-sen (1.2448) lines can also be sources of signals. Signals can be "bounces" and "breakthroughs" of these levels and lines. The Stop Loss level is recommended to be set at breakeven when the price moves in the correct direction by 20 points. The lines of the Ichimoku indicator may move during the day, which should be considered when determining trade signals. Also, the illustration shows support and resistance levels that can be used to fix profits on trades. No important macroeconomic publications are planned for Thursday in the UK or the US. Therefore, we do not expect trending or volatile movements. The Ichimoku indicator lines are fixed, as they can now merge. In any case, false signals may form around them, as the market is currently flat.
Explanations for illustrations:
Price support and resistance levels - thick red lines around which the movement may end. They are not sources of trade signals.
Kijun-sen and Senkou Span B lines - Ichimoku indicator lines transferred to the hourly timeframe from the 4-hour timeframe. They are strong lines.
Extreme levels - thin red lines from which the price previously bounced. They are sources of trade signals.
Yellow lines - trend lines, channels, and other technical patterns.
Indicator 1 on COT charts - the size of the net position for each category of traders.
Indicator 2 on COT charts - the size of the net position for the "non-commercial" group.


