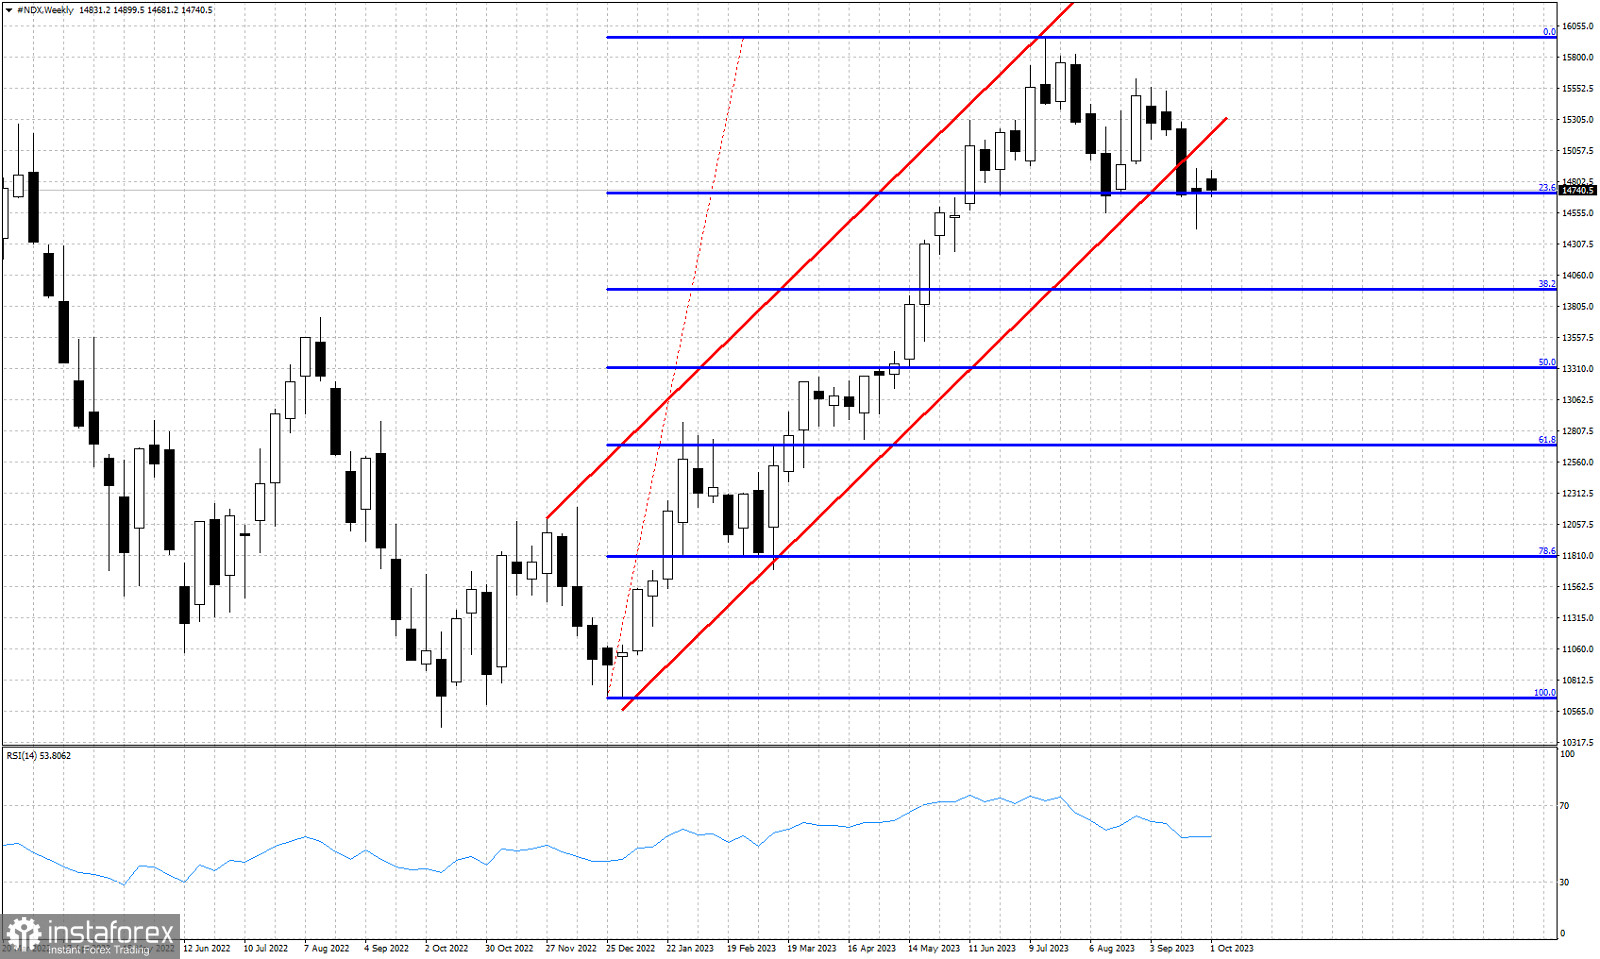
Red lines -bullish channel
blue lines- Fibonacci retracement levels
NASDAQ is trading around 14,755.. The index remains under pressure after exiting the bullish channel it was in. Price has stopped at the 23.6% Fibonacci retracement. The index briefly made a new lower low yesterday at 14,428, but the index closed above the recent low. Recent low at 14,428 is very important also on an intraday basis. A break below it will be a sign of weakness. In general NASDAQ remains vulnerable to more downside. The 13,950 level where we find the 38% Fibonacci retracement is our next downside target. We find resistance at 15,626. As long as we trade below this level, we prefer to be neutral if not bearish.


