


Trend analysis (Fig. 1).
On Friday, the pair will attempt to go down from 1.2438 (the close of yesterday's candlestick) to the 76.4% retracement level of 1.2391 (the blue dotted line). A bullish correction will occur if the pair reaches the target.
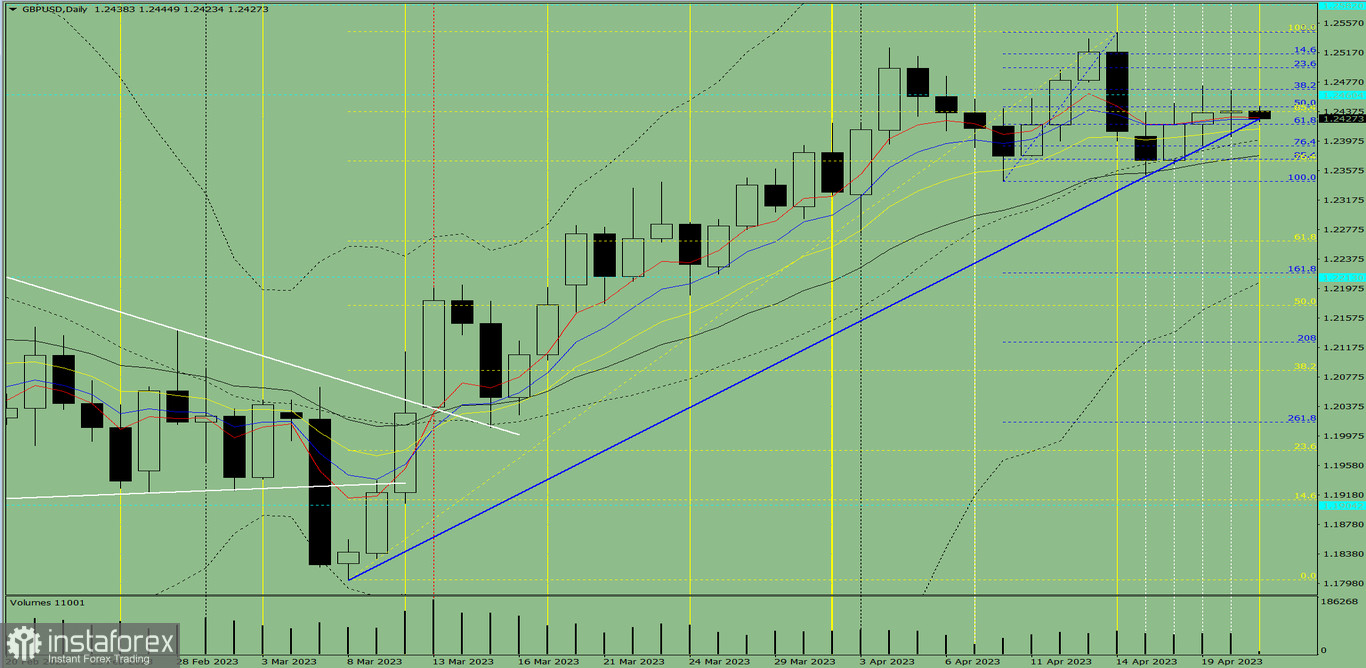
Fig. 1 (daily chart).
Complex analysis:
- indicator analysis - down;
- Fibonacci levels - down;
- volumes - down;
- candlestick analysis - down;
- trend analysis - up;
- Bollinger bands - up;
- weekly chart - down.
Final thoughts:
Today, the pair will attempt to go down from 1.2438 (the close of yesterday's candlestick) to the 76.4% retracement level of 1.2391 (the blue dotted line). A bullish correction will occur if the pair reaches the target. In such a case, the mark of 1.2467 will stand as the next target.
Alternatively, from the level of 1.2438 (the close of yesterday's candlestick), the price may fall to the 85.4% retracement level of 1.2373 (the blue dotted line). A bullish correction may occur if the pair reaches the target. In such a case, the mark of 1.2473 will stand as the next target (the daily candlestick formed on April 19, 2023).


