


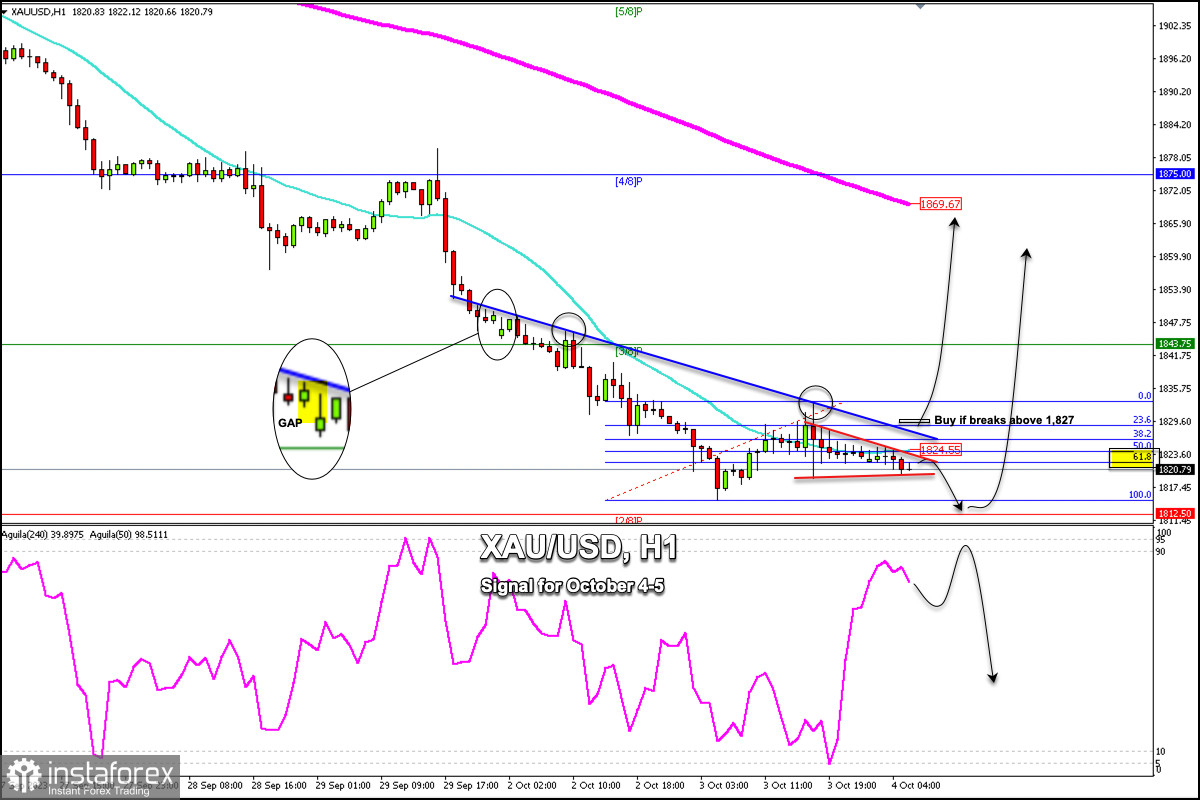
Early in the European session, gold is trading around 1,820.79, below the 21 SMA, and below the downtrend channel formed earlier this week.
Gold registered a new low around 1,815.12 and from that point, it has made a rebound but without the strength to consolidate gains. The chart shows a recovery in gold but there is strong downward pressure which prevents gold from its further recovery.
According to the 1-hour chart, we can see that on October 2, gold left a gap around 1,849.85. Technically, there is a strong possibility that gold will return to this level and cover the Gap in the next few days.
For gold to reach 1,849, the key will be that the price settles above 1,827. Then, it will be seen as an opportunity to buy.
This daily pivot point is located at 1,823. If gold consolidates above this area, the key will be to wait until it continues trading above 1,827. Gold is likely to reach 1,849 in the coming days, but we should wait for confirmation above the 21 SMA and above 1,827.
In the chart, we can see that if XAU/USD continues its downtrend, it could reach 1,812 around 2/8 Murray. If gold reaches this point, a technical rebound could occur. On the other hand, above 1,925, the price could recover and reach 1,869 where the 200 EMA is located.
Our trading plan for the next few hours is to buy gold only if it trades above 1,827, with targets at 1,843 (3/8 Murray), 1,849 (GAP), and 1,869 (4/8 Murray). The Eagle indicator is showing an overbought signal due to the strong technical bounce that occurred, but after a bearish signal, it is likely to resume its uptrend.


