


Analysis of macroeconomic reports:
On Monday, the European Union and the United States will not release any important reports. No secondary reports either. There will be a few tertiary reports in Germany, which aren't that interesting even if the market is flat. Thus, we are expecting a "boring Monday" unless the market presents a surprise.
Fundamental events:
There is absolutely nothing to highlight from the fundamental events on Monday since the calendar is empty. We might see something interesting during the day, since there might be unplanned speeches, but the chances are very low. In any case, it is impossible to predict in advance where and when a specific politician or central bank official will speak.
General conclusions:
Monday promises to be absolutely boring, as there is not a single event that could be of interest. I believe that there is a 90% probability of witnessing a low-volatility flat. However, there is still a 10% chance for various unforeseen events and circumstances.
Basic rules of the trading system:
1) The strength of the signal is determined by the time it took the signal to form (a rebound or a breakout of the level). The quicker it is formed, the stronger the signal is.
2) If two or more positions were opened near a certain level based on a false signal (which did not trigger a Take Profit or test the nearest target level), then all subsequent signals at this level should be ignored.
3) When trading flat, a pair can form multiple false signals or not form them at all. In any case, it is better to stop trading at the first sign of a flat movement.
4) Trades should be opened in the period between the start of the European session and the middle of the US trading hours when all positions must be closed manually.
5) You can trade using signals from the MACD indicator on the 30-minute time frame only amid strong volatility and a clear trend that should be confirmed by a trendline or a trend channel.
6) If two levels are located too close to each other (from 5 to 15 pips), they should be considered support and resistance levels.
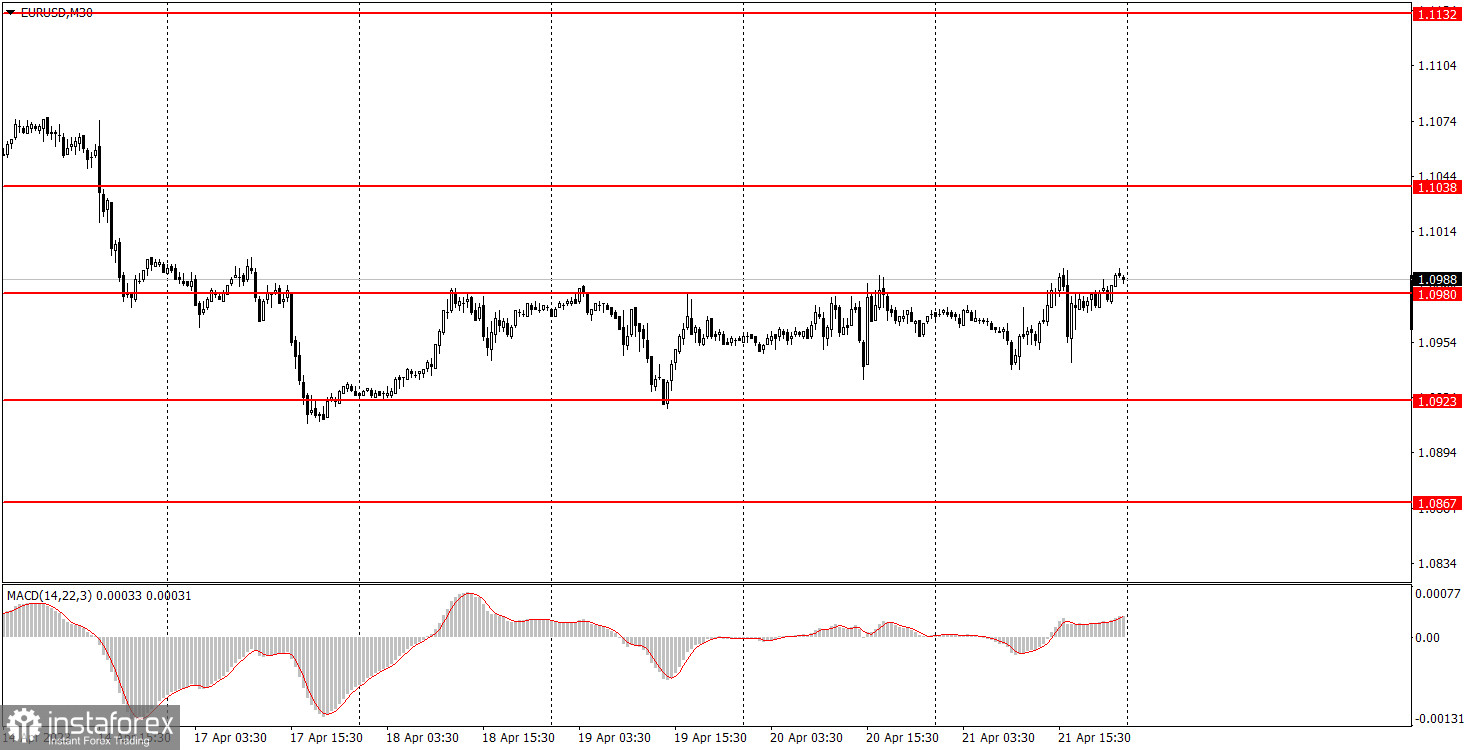
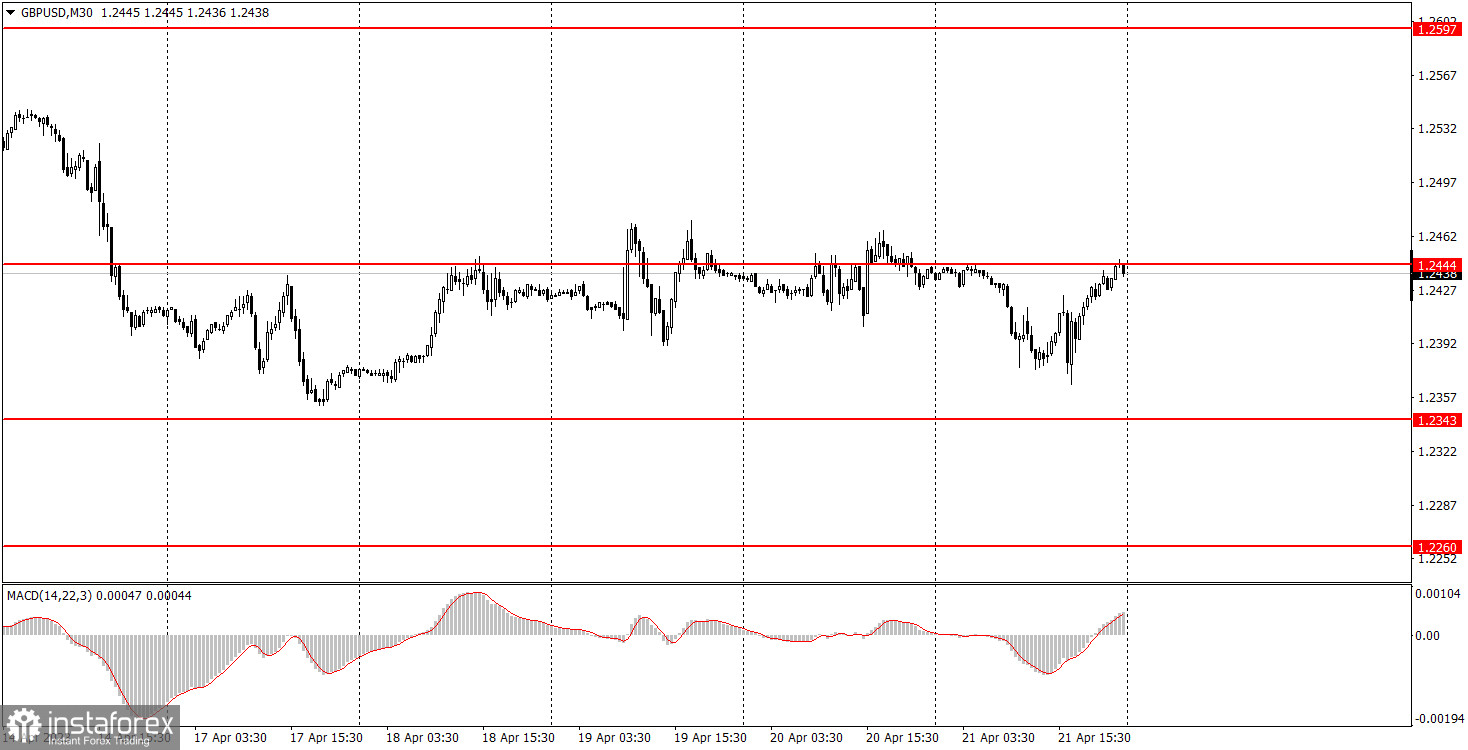
On the chart:
Support and Resistance levels are the levels that serve as targets when buying or selling the pair. You can place Take Profit near these levels.
Red lines are channels or trend lines that display the current trend and show in which direction it is better to trade now.
The MACD indicator (14, 22, and 3) consists of a histogram and a signal line. When they cross, this is a signal to enter the market. It is recommended to use this indicator in combination with trend patterns (channels and trendlines).
Important announcements and economic reports that can be found on the economic calendar can seriously influence the trajectory of a currency pair. Therefore, at the time of their release, we recommend trading as carefully as possible or exiting the market in order to avoid sharp price fluctuations.
Beginners on Forex should remember that not every single trade has to be profitable. The development of a clear strategy and money management is the key to success in trading over a long period of time.


