


EUR/USD
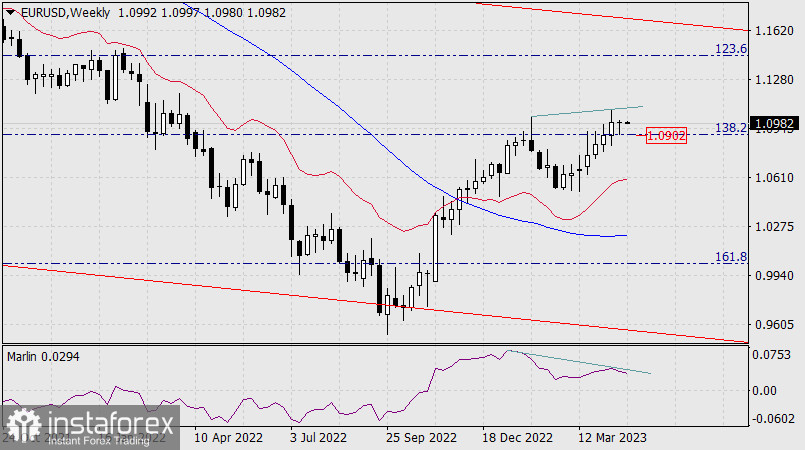
On the weekly chart, the divergence between the price and the Marlin oscillator has slightly intensified over the past week. The price going below the Fibonacci 138.2% level (1.0902) will obviously cement this formation.
On the daily chart, the MACD indicator line coincides with the Fibonacci level (1.0900). The 1.09 level is quite strong, so it can trigger a reversal into a medium-term downtrend.
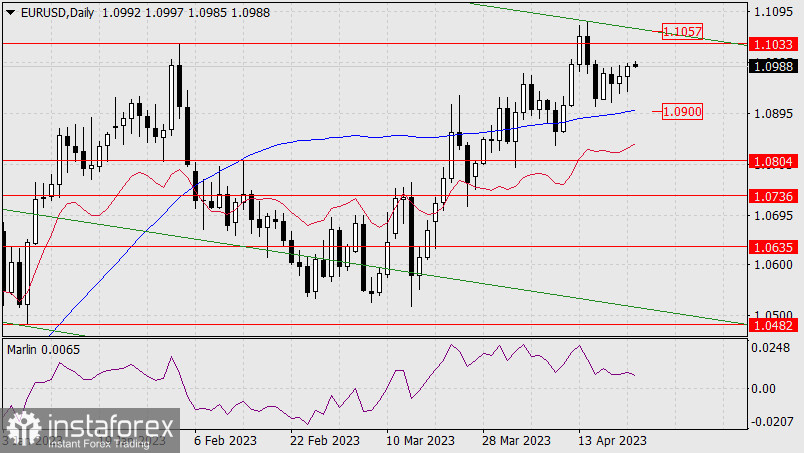
The nearest target is 1.0804 – the February 14th high. Price resistances are 1.1033, 1.1057 – the upper limit of the descending price channel. The Marlin oscillator is pointing downward, it also wants to move into the area of the downtrend.
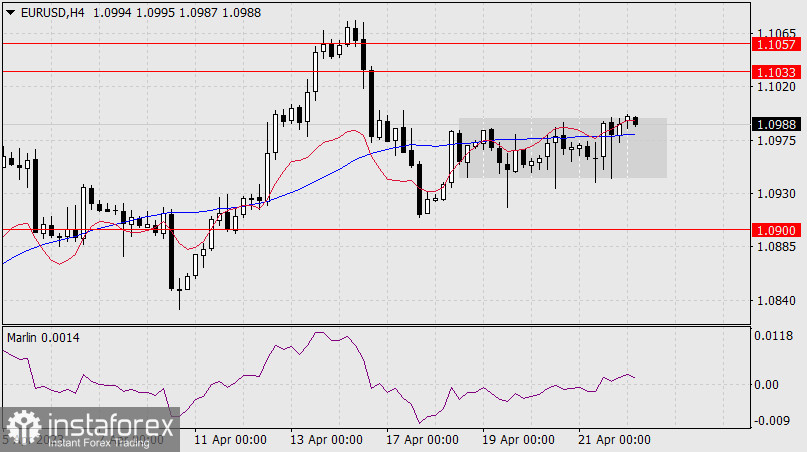
On the four-hour chart, the price still cannot break away from the MACD line, creating a horizontal range on this line. The most important European Central Bank and Federal Reserve meetings will take place next week, which will determine the direction of global currencies. We assume that the dollar will strengthen. The euro will probably be at the 1.0900 level during the Fed meeting.


