


EUR/USD Analysis 5M.
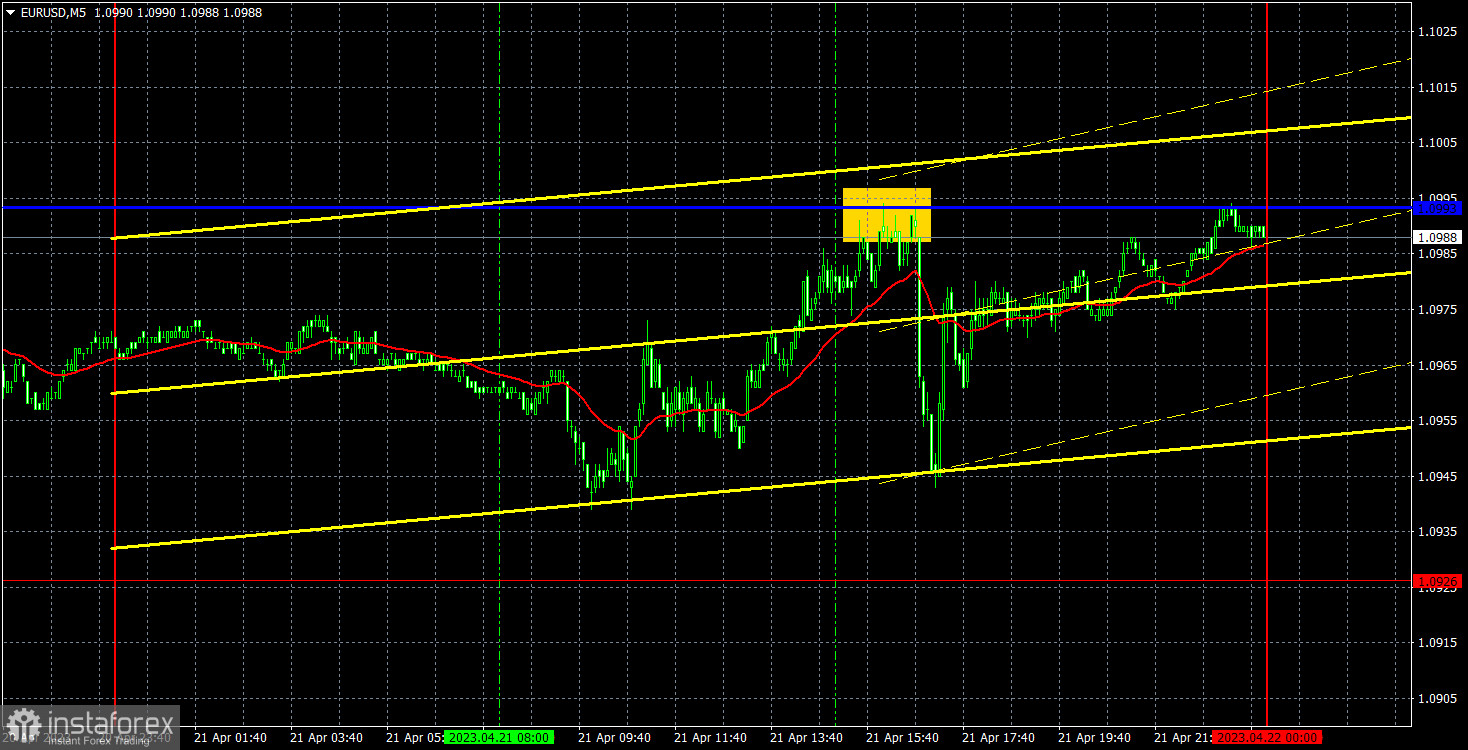
The currency pair EUR/USD continued to trade in absolute flat during the week's last trading day. Volatility was minimal, and trend movement was absent for four days. Interestingly, macroeconomic statistics were released on Friday in the US and the European Union but could not influence traders' sentiment enough to end the flat. There was some market reaction to business activity data, but only for US data. All three indices in the US were slightly better than forecast, strengthening the American currency. A strengthening of 40 points was followed by a drop of the same 40 points. Thus, the market formally processed the data from the US, but practically there is no sense in it. The pair remained in flat mode. Throughout the past week, the price could not find a single reason to start falling.
There was only one trading signal on Friday, and it could work out. At the beginning of the American session, the price bounced off the critical line and dropped 40 points. It was during this time that US business activity reports were published. However, even if traders processed this short position signal, they probably didn't make a profit, as the pair didn't reach the target level and returned up within the next hour. Typical flat movements.
COT Report:
A new COT report for April 18th was released on Friday. In the past 7-8 months, COT report data has fully corresponded to what is happening in the market. The illustration above clearly shows that the net position of large players (the second indicator) began to grow in September 2022. Around the same time, the European currency began to grow. At this time, the net position of non-commercial traders remains "bullish." It remains very high, as do the positions of the European currency, which cannot properly correct downward. We have already drawn traders' attention to the fact that a fairly high "net position" value allows for the imminent completion of the upward trend. The first indicator, which frequently occurs before the end of the trend, indicates this when the red and green lines have moved far apart from one another. The European currency tried to start falling, but we have only seen a trivial downward pullback so far. During the last reporting week, the number of buy contracts in the "non-commercial" group decreased by 1.8 thousand, and the number of shorts decreased by 2.8 thousand. Accordingly, the net position has mostly stayed the same. The number of buy contracts is higher than that of sell contracts for non-commercial traders by 164 thousand. A correction is still brewing, so even without the COT reports, it is clear that the pair should start a new decline. But for now, we only see movement to the north.
EUR/USD Analysis 1H.
The pair's position above the trend line and the Senkou Span B line on the hourly timeframe indicates it is still moving upward. Despite a strong pullback on Friday and Monday, everything has technically stayed the same. It is still very difficult for the dollar to show growth, which is strange and surprising since there are no strong reasons for the euro to grow. In the last few days, a flat has been observed. For Monday, we highlight the following trading levels: 1.0658-1.0669, 1.0762, 1.0806, 1.0868, 1.0926, 1.1033, 1.1076, 1.1137-1.1185, 1.1234, 1.1274, as well as Senkou Span B (1.0882) and Kijun-sen (1.0993) lines. The lines of the Ichimoku indicator may move during the day, which should be considered when determining trading signals. There are also auxiliary support and resistance levels, but no signals are formed around them. Signals can be "bounces" and "overcomings" of extremum levels and lines. Remember to place a stop-loss order at breakeven if the price has moved in the right direction by 15 points. This will protect against possible losses if the signal turns out to be false. On April 24th, no events or reports are planned in the European Union or the United States. The day will be empty, so there is a very high likelihood of low volatility and flat persistence. Of course, there may be surprises, but we believe that the flat will continue.
Explanations for illustrations:
Price support and resistance levels – thick red lines around which the movement may end. They are not sources of trading signals.
Kijun-sen and Senkou Span B lines – lines of the Ichimoku indicator, transferred to the hourly timeframe from the 4-hour. They are strong lines.
Extremum levels – thin red lines from which the price previously bounced. They are sources of trading signals.
Yellow lines – trend lines, channels, and other technical patterns.
Indicator 1 on COT charts – the size of the net position for each category of traders.
Indicator 2 on COT charts – the size of the net position for the "non-commercial" group.


