


Trend analysis (Fig. 1).
The market may move downward from the level of 1.0985 (closing of Friday's daily candle) with the target at 1.0943, the 23.6% pullback level (yellow dotted line). When testing this level, the price may move upward with the target at 1.0994, the 14.6% pullback level (yellow dotted line).
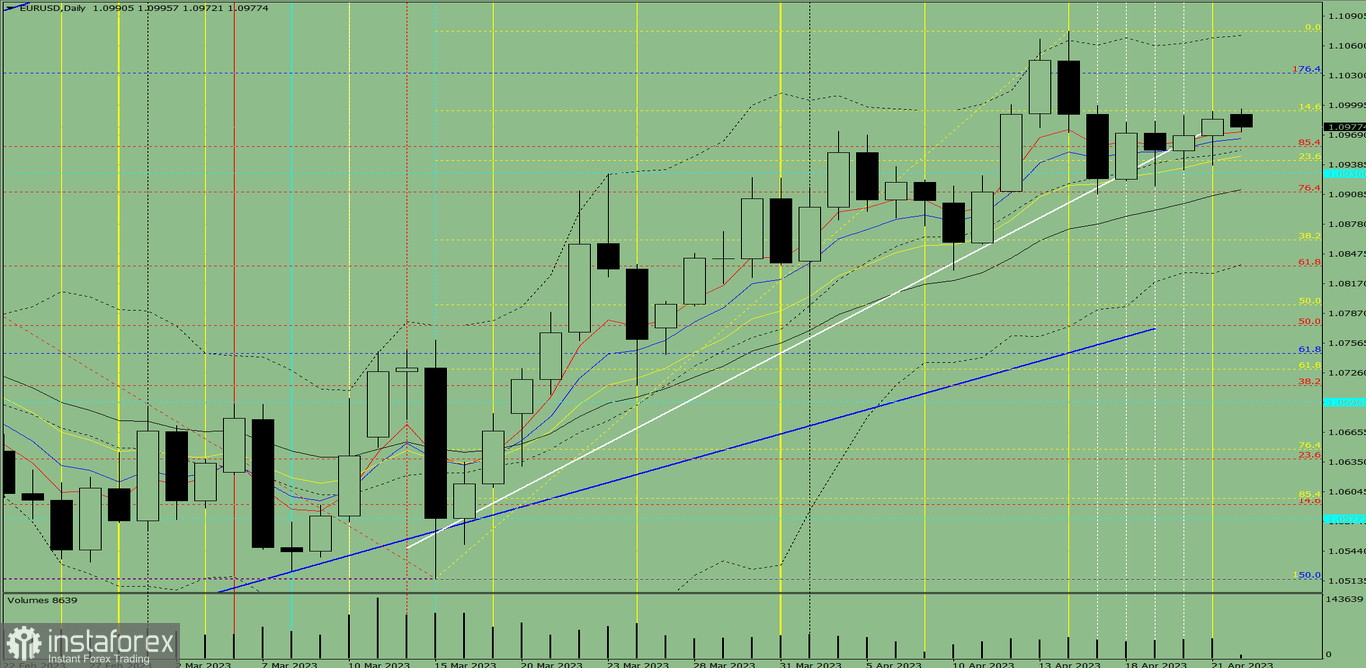
Fig. 1 (daily chart).
Comprehensive analysis:
- Indicator analysis - down;
- Fibonacci levels - down;
- Volumes - down;
- Candlestick analysis - down;
- Trend analysis - up;
- Bollinger bands - down;
- Weekly chart - down.
General conclusion:
Today, the price may move downward from the level of 1.0985 (closing of Friday's daily candle) with the target at 1.0943, the 23.6% pullback level (yellow dotted line). When testing this level, the price may move upward with the target at 1.0994, the 14.6% pullback level (yellow dotted line).
Alternatively, the price may move downward from the level of 1.0985 (closing of Friday's daily candle) with the target at 1.0911, the 76.4% pullback level (red dotted line). When testing this level, the price may move upward with the target at 1.0930, the historical resistance level (blue dotted line).


