


Trend analysis
GBP/USD may start moving down this week, starting from the level of 1.2438 (closing of the last weekly candle) to 1.2260, which is the 38.2% retracement level (red dotted line). Upon reaching this price, the pair will resume an upward movement towards 1.2545, which is the upper fractal (red dotted line).
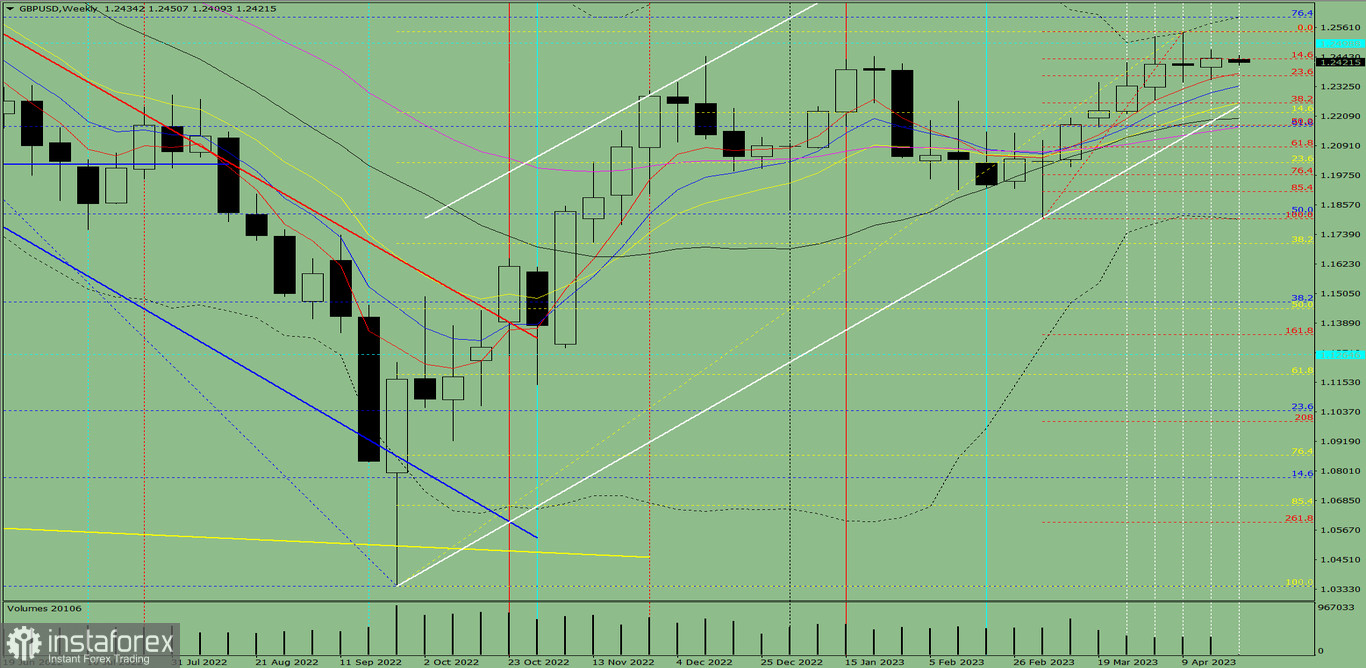
Fig. 1 (weekly chart)
Comprehensive analysis:
Indicator analysis - downward
Fibonacci levels - downward
Volumes - downward
Candlestick analysis - downward
Trend analysis - upward
Bollinger bands - upward
Monthly chart - downward
All this points to a downward movement in GBP/USD.
Conclusion: The pair will most likely have a bearish trend, with no first upper shadow on the weekly black candle (Monday - downward) and a second lower shadow (Friday - upward).
So during the week, there will be a decline in pound from 1.2438 (closing of the last weekly candle) to the 38.2% retracement level at 1.2260 (red dotted line), followed by a rise to the upper fractal at 1.2545 (red dotted line).
Alternatively, the quote may go down from 1.2438 (closing of the last weekly candle) to the 50.0% retracement level at 1.2167 (red dotted line), and then bounce up to the historical resistance level at 1.2499 (blue dotted line).


