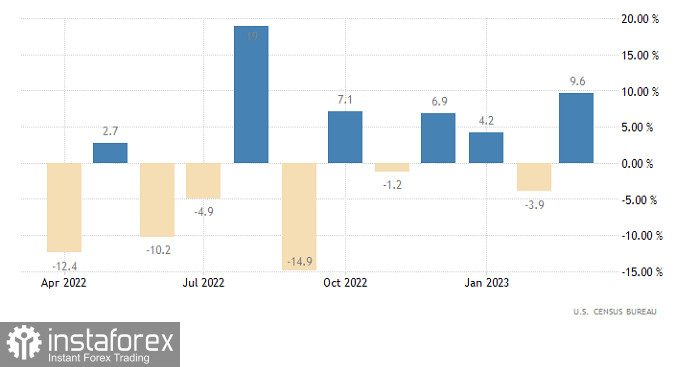
It was assumed that new home sales in the United States would decrease by -0.5%, but suddenly, they jumped as much as 9.6%. So, investors who were initially prepared to sell the dollar further had instead begun to open longs on the dollar. The results of the housing prices report didn't even stop them, the growth rate of which slowed from 5.3% to 4.0%. Especially since estimates were a slowdown to 3.9%. And so, US macro data turned out to be better than forecasts. And the sales data was simply delightful.
New home sales (United States):

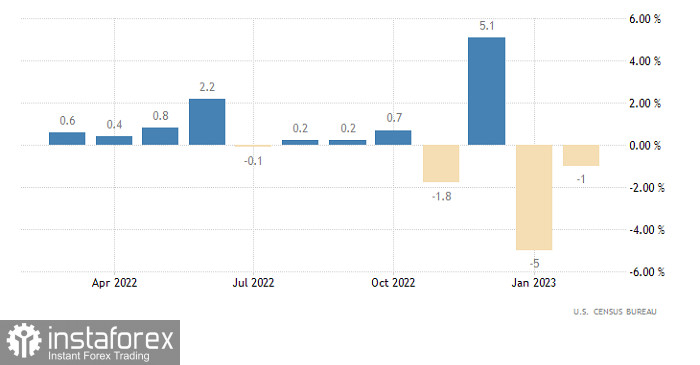
And today, the dollar may continue rising. This time, the reason should be orders for durable goods. According to forecasts, they can grow by 0.6%. So, the dollar should continue to grow. But only if the actual data matches the forecasts. And not like yesterday, when they turned out to be completely opposite.
Orders for durable goods (United States):

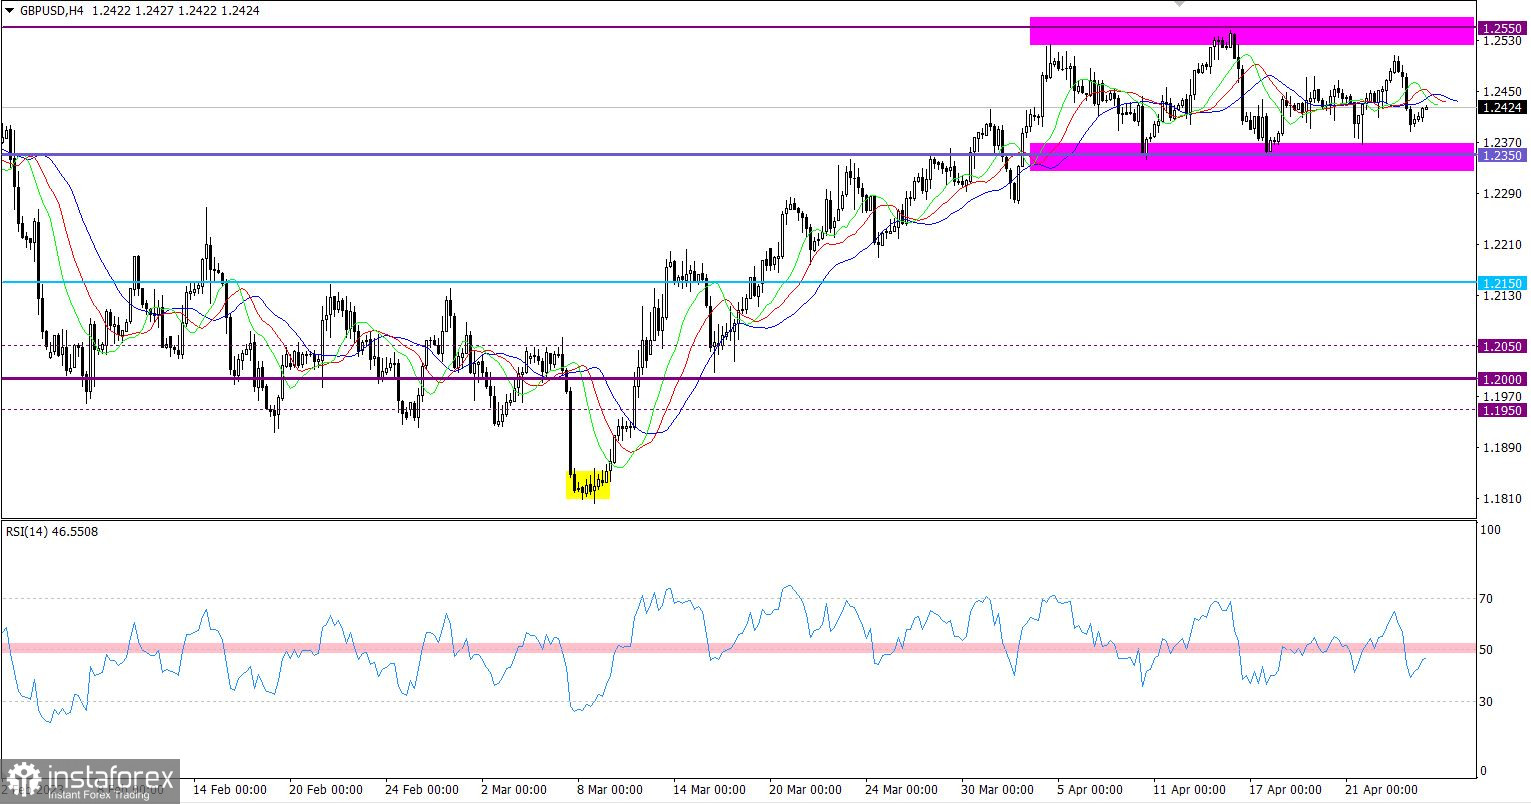
The GBP/USD pair sharply switched to a decline, losing about 0.8% of its value. However, this movement did not lead to anything crucial. The quote still moves within the sideways range of 1.2350/1.2550.
During the downward cycle, on the four-hour chart, the RSI technical indicator crossed the midline 50 downwards. The RSI points to an increase in the volume of short positions for the British pound.
On the four-hour chart, the Alligator's MAs have multiple intersections with each other, which corresponds to a signal of stagnation. In the mid-term, it is directed upwards, which coincides with the trend direction.

Outlook
Traders can work within a flat because the range width is sufficient for speculative activity, as evidenced by the recent price jump. The main strategy is still focused on the outgoing momentum from the flat, which, in a technical perspective, may indicate the succeeding price movement.
In terms of the complex indicator analysis, we see that in the short-term and intraday periods, technical indicators are pointing towards different directions due to the stagnation. In this case, it points to a bearish sentiment due to the downward momentum. In the mid-term period, the indicators are reflecting an upward cycle.


