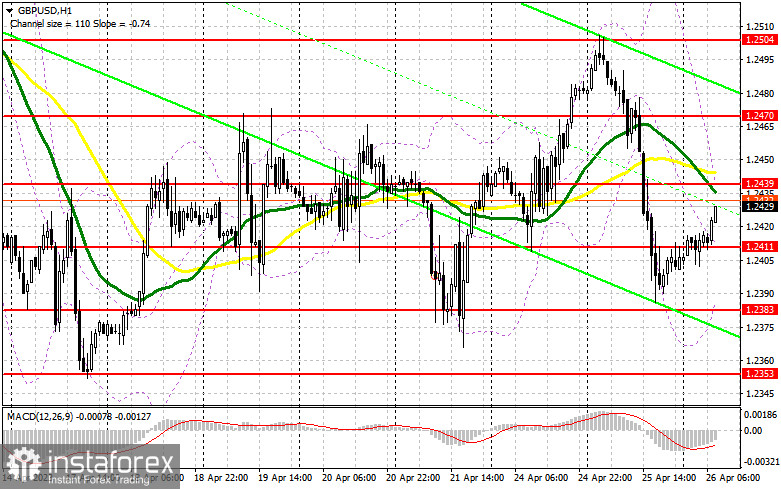
To open long positions on GBP/USD, the following is required:
The main task for pound buyers today is to protect the intermediate support at 1.2411, formed during today's European session. It is unlikely that there will be any market reaction to retail sales data from the Confederation of British Industry, so the bulls will have every chance of an upward correction.

The optimal scenario is a decline in the pound and the formation of a false breakout at 1.2411, which will allow for a buy signal with the prospect of recovery to the area of 1.2439, where the moving averages are, playing on the side of the bears. A breakout and consolidation above this range will form an additional buy signal with a surge to 1.2470. The ultimate target will be the area of 1.2504 – the maximum this week, where I will fix profits.
In the case of a decline to the area of 1.2411 and a lack of activity from the bulls, it is best not to rush with purchases. In this case, I will open long positions only on a false breakout in the area of the next support at 1.2383. I plan to buy GBP/USD immediately on a rebound only from the minimum of 1.2353, with a correction target of 30-35 points within the day.
To open short positions on GBP/USD, the following is required:
Sellers need to show themselves in the area of 1.2439 as if they miss this level, and buyers will return to the market expecting to update weekly highs and maintain the upward trend, an attempt to form which was made at the beginning of this week. The inability of the bulls to break above 1.2439 amid weak statistics from the UK, as well as a false breakout, will give a chance to return pressure on the pound with the prospect of testing 1.2411. A breakout and a reverse test from the bottom to the top of this range will increase pressure on the pound, forming a sell signal with a decline to 1.2383. The ultimate target remains the minimum of 1.2353, where I will fix profits.
Regarding GBP/USD growth and a lack of activity at 1.2439, it is best to postpone sales until testing the next resistance at 1.2470. Only a false breakout there will provide an entry point for short positions. If there is no downward movement, I will sell GBP/USD on a rebound immediately from the maximum of 1.2504, but only with the expectation of a pair correction down by 30-35 points within the day.
The COT report (Commitment of Traders) for April 11th showed an increase in long positions and a decrease in short positions. The market responded favorably to the information on the rate of GDP growth in the UK, which helped to maintain demand for the pound despite the long-overdue downward correction of the pair. Considering that the aggressive policy of the Federal Reserve is coming to an end, and the Bank of England has no choice but to continue raising interest rates and fighting the double-digit level of inflation, demand for the pound can be expected to persist. The correction will be a good reason to enter long positions. The latest COT report states that non-commercial short positions decreased by 3,882 to 57,326, while non-commercial long positions jumped by 8,513 to 54,928. This led to a sharp reduction in the negative value of the non-commercial net position to -2,398 compared to -14,793 a week earlier. The reduction has been happening for the third week in a row, which also confirms the bullish nature of the market. The weekly closing price decreased and amounted to 1.2440 against 1.2519.
Indicator signals:
Moving averages
Trading is being conducted below the 30 and 50-day moving averages, indicating a return of pressure on the pair.
Note: The author on the H1 chart considers the period and prices of the moving averages and differ from the general definition of the classic daily moving averages on the D1 chart.
Bollinger Bands
In case of a decline, the lower border of the indicator in the area of 1.2395 will provide support.
Indicator descriptions
• Moving average (moving average determines the current trend by smoothing volatility and noise). Period 50. Marked in yellow on the chart.
• Moving average (moving average determines the current trend by smoothing volatility and noise). Period 30. Marked in green on the chart.
• MACD indicator (Moving Average Convergence/Divergence – convergence/divergence of moving averages) Fast EMA period 12. Slow EMA period 26. SMA period 9
• Bollinger Bands (Bollinger Bands). Period 20
• Non-commercial traders - speculators, such as individual traders, hedge funds, and large institutions, using the futures market for speculative purposes and meeting certain requirements.
• Non-commercial long positions represent the total long open position of non-commercial traders.
• Non-commercial short positions represent the total short open position of non-commercial traders.
• The total non-commercial net position is the difference between the short and long positions of non-commercial traders.


