


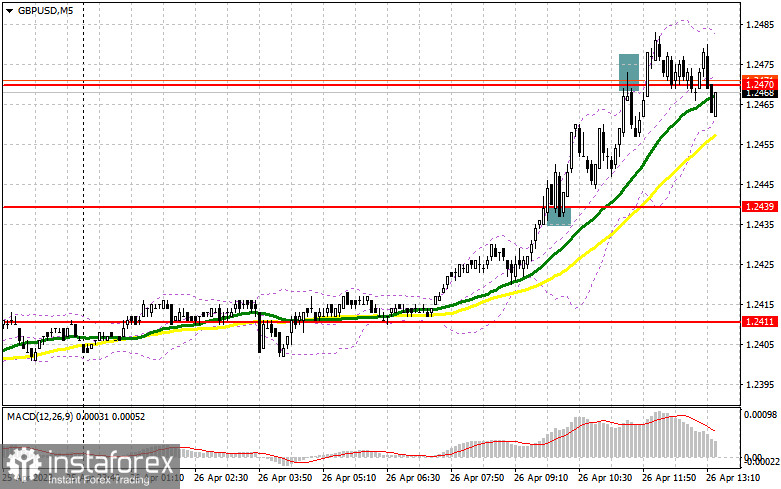
In my morning article, I turned your attention to 1.2439 and recommended making decisions with this level in focus. Now, let's look at the 5-minute chart and figure out what actually happened. A breakout and a downward retest of this level led to a buy signal. The pair rose to 1.2470 where sellers tried to regain control. A false breakout of this level provided a sell signal. However, a significant downward movement did not take place. For the afternoon, the technical outlook has been revised.
When to open long positions on GBP/USD:
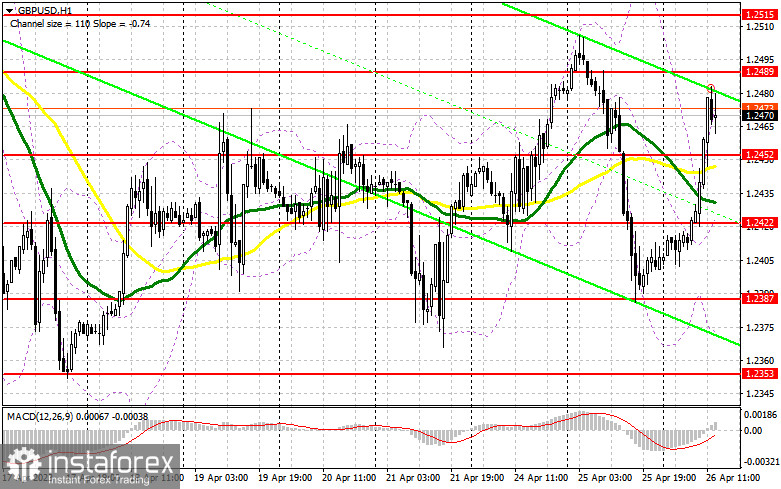
If durable goods orders and the trade balance data turn out to be better than expected, demand for the US dollar will return. If so, a downward correction of GBP/USD may occur. this scenario looks quite likely. This is why it is quite risky to buy at current highs. A false breakout of 1.2452 where the moving averages are passing will give a new entry point into long positions. The pair could advance to the resistance level of 1.2489, which is the weekly high. A breakout and a downward retest of this level could create a buy signal with an increase to 1.2515. A more distant target will be the 1.2542 level where I recommend locking in profits
If the pair declines to 1.2452 amid strong macro stats and the bulls show no activity, I would advise you to open long positions only after a false breakout of the support level of 1.2422. You could buy GBP/USD at a bounce from 1.2387, keeping in mind an upward intraday correct 30-35 pips.
When to open short positions on GBP/USD:
Sellers did not enter the market today. It is quite predictable given the upbeat reports. For this reason, it is better not to rush into short positions in the afternoon. One should wait for a false breakout of the resistance level of 1.2489. It may trigger a correction of the pound sterling with the prospect of a drop to the support level of 1.2452. A breakout and an upward retest of this level amid strong US data will increase pressure on GBP/USD. It could generate a sell signal with a decline to 1.2422. A more distant target level is the low of 1.2387 where I recommend locking in profits.
If GBP/USD rises and bears show no energy at 1.2489 in the afternoon, which is also quite likely, I would advise you to postpone short positions until a test and a breakout of the resistance level of 1.2515. If there is no downward movement there, you could sell GBP/USD at a bounce from 1.2542, keeping in mind a downward intraday correction of 30-35 pips.
COT report
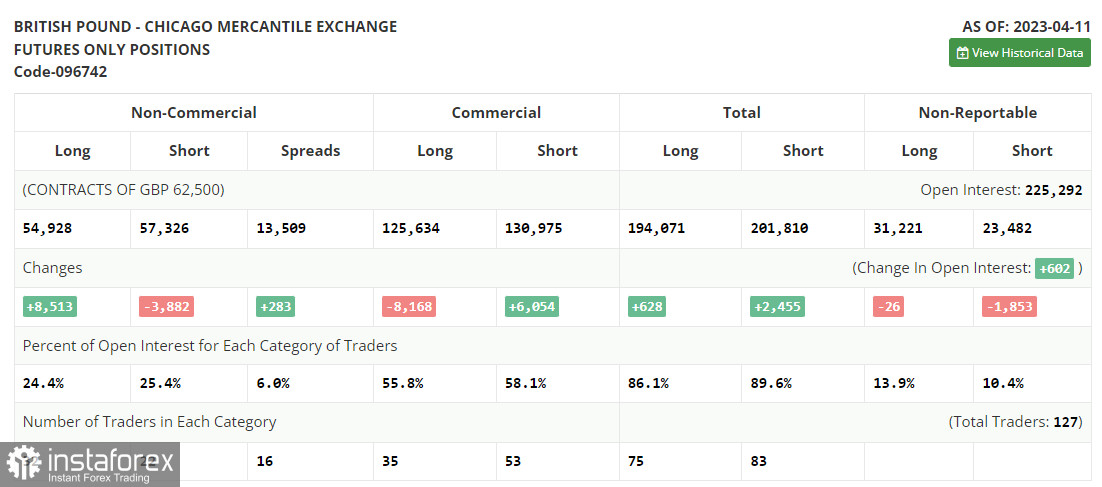
The COT report (Commitment of Traders) for April 11 logged an increase in long positions and a drop in short ones. The latest data on the UK indicates the likelihood of further monetary tightening in the UK, boosting demand for the pound sterling. Given that the Fed's tightening cycle is coming to an end and the Bank of England has to raise interest rates further due to double-digit inflation, the pound sterling is likely to climb. If the correction starts, one should go long. The latest COT report showed that short non-profit positions decreased by 3,882, to 57,326, while long non-profit positions jumped by 8,513, to 54,928. This led to a sharp decline in the negative delta of the non-commercial net position to -2,398 against -14,793 a week earlier. It has been dropping for the third week in a row, which also signals a bull market. The weekly closing price fell to 1.2440 against 1.2519.
Indicators' signals:
Trading is carried out above the 30 and 50 daily moving averages, which indicates that bulls are trying to take control.
Moving averages
Note: The period and prices of moving averages are considered by the author on the H1 (1-hour) chart and differ from the general definition of the classic daily moving averages on the daily D1 chart.
Bollinger Bands
If EUR/USD declines, the indicator's upper border at 1.2375 will serve as support.
Description of indicators
- Moving average (moving average, determines the current trend by smoothing out volatility and noise). Period 50. It is marked yellow on the chart.
- Moving average (moving average, determines the current trend by smoothing out volatility and noise). Period 30. It is marked green on the chart.
- MACD indicator (Moving Average Convergence/Divergence - convergence/divergence of moving averages) Quick EMA period 12. Slow EMA period to 26. SMA period 9
- Bollinger Bands (Bollinger Bands). Period 20
- Non-commercial speculative traders, such as individual traders, hedge funds, and large institutions that use the futures market for speculative purposes and meet certain requirements.
- Long non-commercial positions represent the total long open position of non-commercial traders.
- Short non-commercial positions represent the total short open position of non-commercial traders.
- Total non-commercial net position is the difference between the short and long positions of non-commercial traders.


