


When to open long positions on EUR/USD:
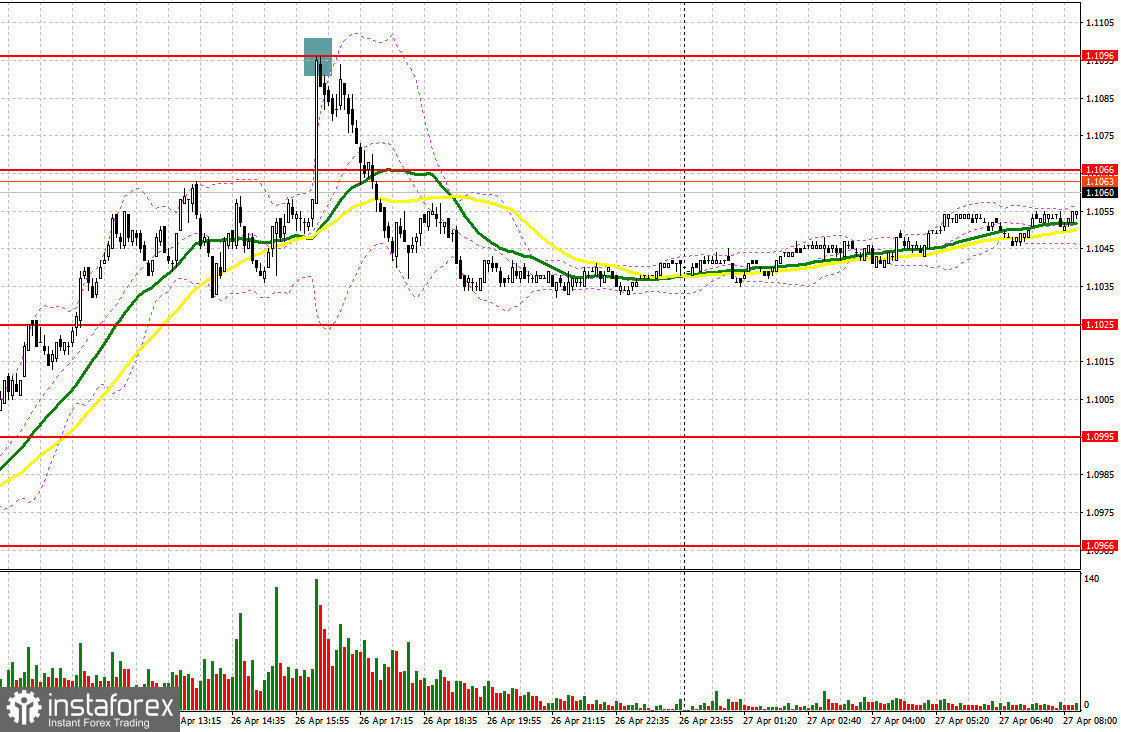
Yesterday, there was only one entry point. Now, let's look at the 5-minute chart and figure out what actually happened. In my morning article, I turned your attention to 1.0889 and recommended making decisions with this level in focus. A breakout of this level came without a downward retest. For this reason, there was no buy signal. Traders also refrained from selling at1.1029 as the upward retest of this level also did not take place. In the afternoon, short positions on a rebound from 1.1096 brought 30 pips of profit. After testing this level, demand for the euro sharply decreased. The pair tumbled as well.
The bulls are trying to push the pair to the monthly high again today. However, it is hard to tell whether they will succeed. If the Eurozone Consumer Confidence Index is positive, it may help the euro rise to the pivot level. However, in the afternoon, the US will reveal economic reports which could impact market sentiment significantly. Speculators are likely to pay zero attention to the speech of ECB Executive Board Member Fabio Panetta as the ECB's plans are clear.
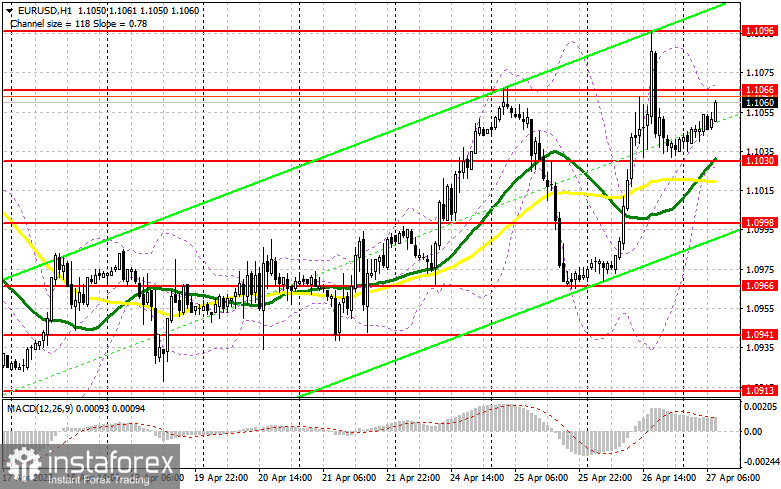
I would advise you to buy the euro on the decline. You should focus on 1.1030 where the moving averages which are benefiting bulls are passing. A false breakout of this level will lead to a buy signal and an increase to the resistance level of 1.1066. A breakout and a downward retest of this level will boost bullish sentiment, providing an additional entry point into long positions. the pair is likely to appreciate to the monthly high of 1.096. A more distant target will be the level of 1.1129 where I recommend locking in profits.
If EUR/USD drops and bulls show no activity at 1.1030, which is quite likely after the release of important US data, the pressure on the pair will only increase. Only a false breakout of the support level of 1.0998 will give a buy signal. You could buy EUR/USD at a bounce from the low of 1.0966, keeping in mind an upward intraday correction of 30-35 pips.
When to open short positions on EUR/USD:
Sellers lost control. So, the pair reached new monthly highs, which signals an uptrend. Today, bears need to protect the resistance level of 1.1066. The euro failed to consolidate above this level yesterday. A negative market reaction to the eurozone data as well as a false breakout of this level will create a sell signal. The pair could sink to 1.1030. If it drops below this level and there is an upward retest, the euro is likely to fall to 1.0998. A more distant target will be 1.0966, the low of last week. I recommend locking in profits at this level.
If EUR/USD rises during the European session and the bears show no energy at 1.1066, which is highly likely as bulls will try to cement the uptrend in the morning, I would advise you to postpone short positions until a breakout of 1.096. Yesterday, many traders generated a profit at this level after a rebound. You could sell EUR/USD at a bounce from 1.1129, keeping in mind a downward intraday correction of 30-35 pips.
COT report:
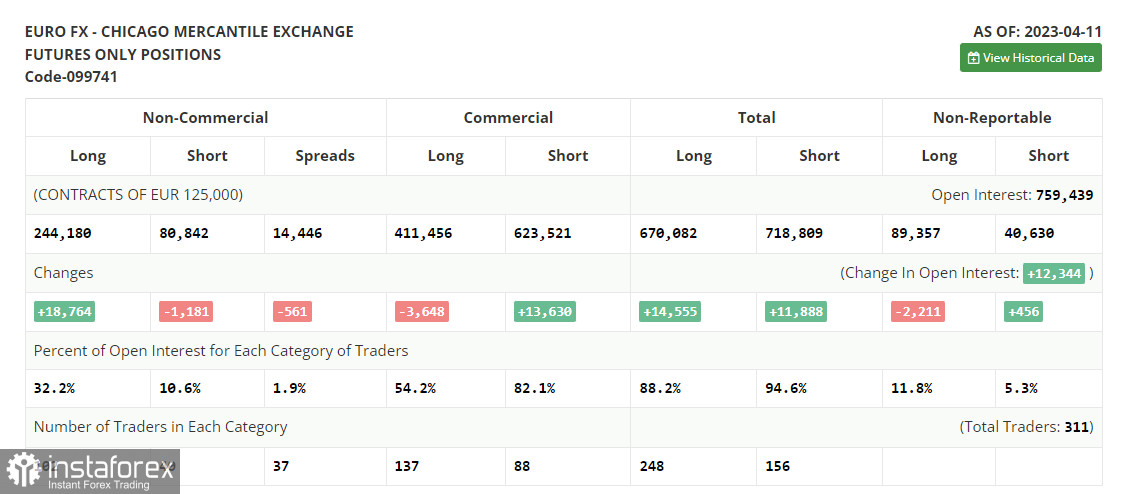
The COT report (Commitment of Traders) for April 11 logged a rise in long positions and a drop in short ones. The latest US economic reports signaled a gradual overheating of the labor market as well as a decline in retail sales. It is likely to ease inflationary pressure in the United States, allowing the Fed to end the tightening cycle. However, according to the meeting minutes for March, Fed policymakers are not planning to abandon aggressive tightening. At the May meeting, the regulator could raise the key rate by 0.25%. It will help the US dollar maintain its lead against the euro, trading below 1.1000. This week, there will be no crucial economic reports, excluding PMI data. So, the bears could facilitate the downward correction. The COT report showed that long non-commercial positions increased by 18,764 to 244,180, while short non-commercial positions declined by 1,181 to 80,842. At the end of the week, the total non-commercial net position amounted to 162,496 against 143,393. The weekly closing price fell to 1.0950 against 1.1.
Indicators' signals:
Trading is carried out above the 30 and 50 daily moving averages, which indicates bullish sentiment.
Moving averages
Note: The period and prices of moving averages are considered by the author on the H1 (1-hour) chart and differ from the general definition of the classic daily moving averages on the daily D1 chart.
Bollinger Bands
If EUR/USD declines, the indicator's lower border at 1.1030 will serve as support.
Description of indicators
- Moving average (moving average, determines the current trend by smoothing out volatility and noise). Period 50. It is marked yellow on the chart.
- Moving average (moving average, determines the current trend by smoothing out volatility and noise). Period 30. It is marked green on the chart.
- MACD indicator (Moving Average Convergence/Divergence - convergence/divergence of moving averages) Quick EMA period 12. Slow EMA period to 26. SMA period 9
- Bollinger Bands (Bollinger Bands). Period 20
- Non-commercial speculative traders, such as individual traders, hedge funds, and large institutions that use the futures market for speculative purposes and meet certain requirements.
- Long non-commercial positions represent the total long open position of non-commercial traders.
- Short non-commercial positions represent the total short open position of non-commercial traders.
- Total non-commercial net position is the difference between the short and long positions of non-commercial traders.


