


Analyzing Monday's trades:
GBP/USD on 30M chart
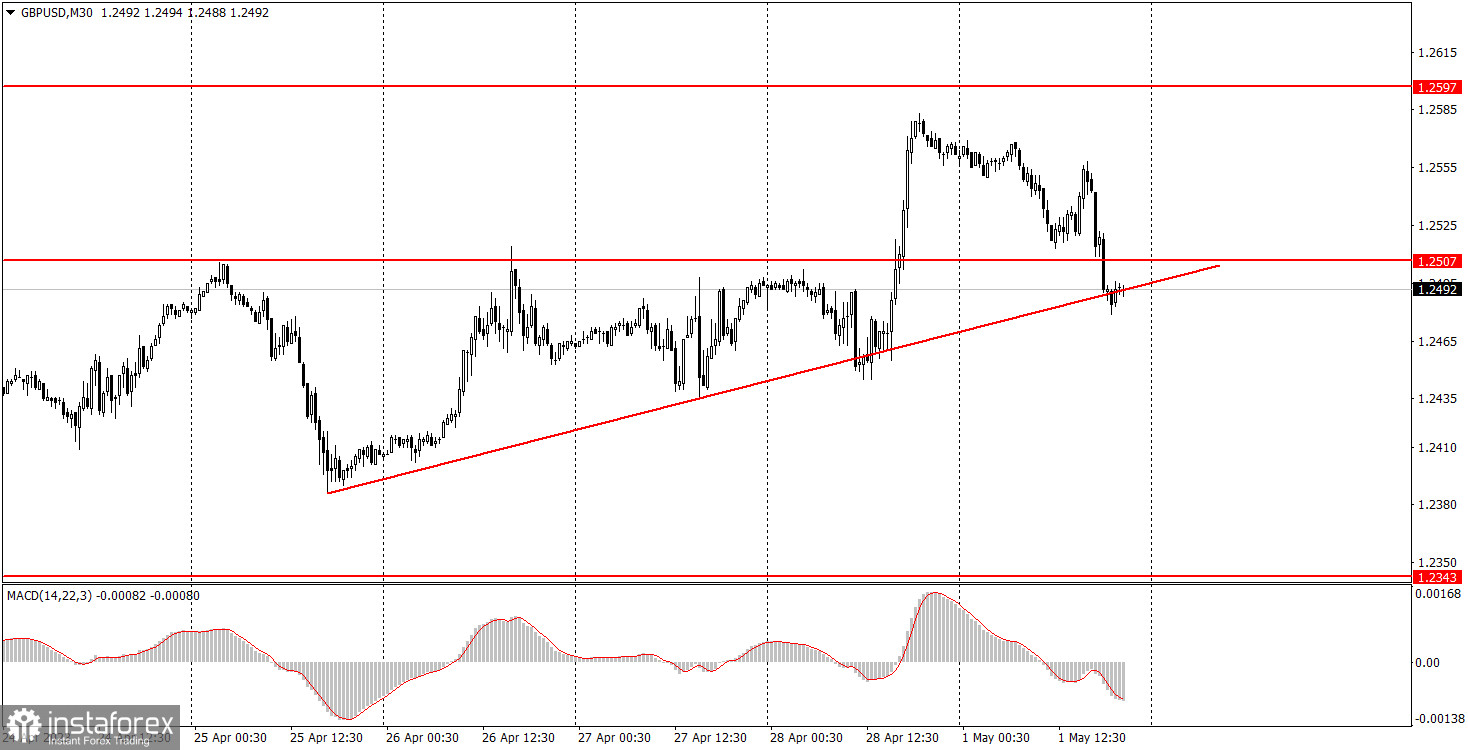
The GBP/USD pair also showed a noticeable drop on Monday but is still staying above the last uptrend line. I have mentioned earlier that now all uptrend lines just serve as a formality, because even if the quotes cross this line, the decline would not go further. It could be the same this time. The price could bounce off the trend line and still maintain an uptrend, but in case of a breakthrough, we may see a slight decline, followed by growth. Moreover, this week there will be many important events that could provoke a drop in the dollar. Therefore, one should not be overly happy about the appearance of a sell signal in the form of overcoming the trend line. On Monday, the dollar's growth was provoked solely by business activity reports in the US. However, so far, the dollar has shown only minimal strengthening, and it clearly can't pull off a trend.
GBP/USD on 5M chart
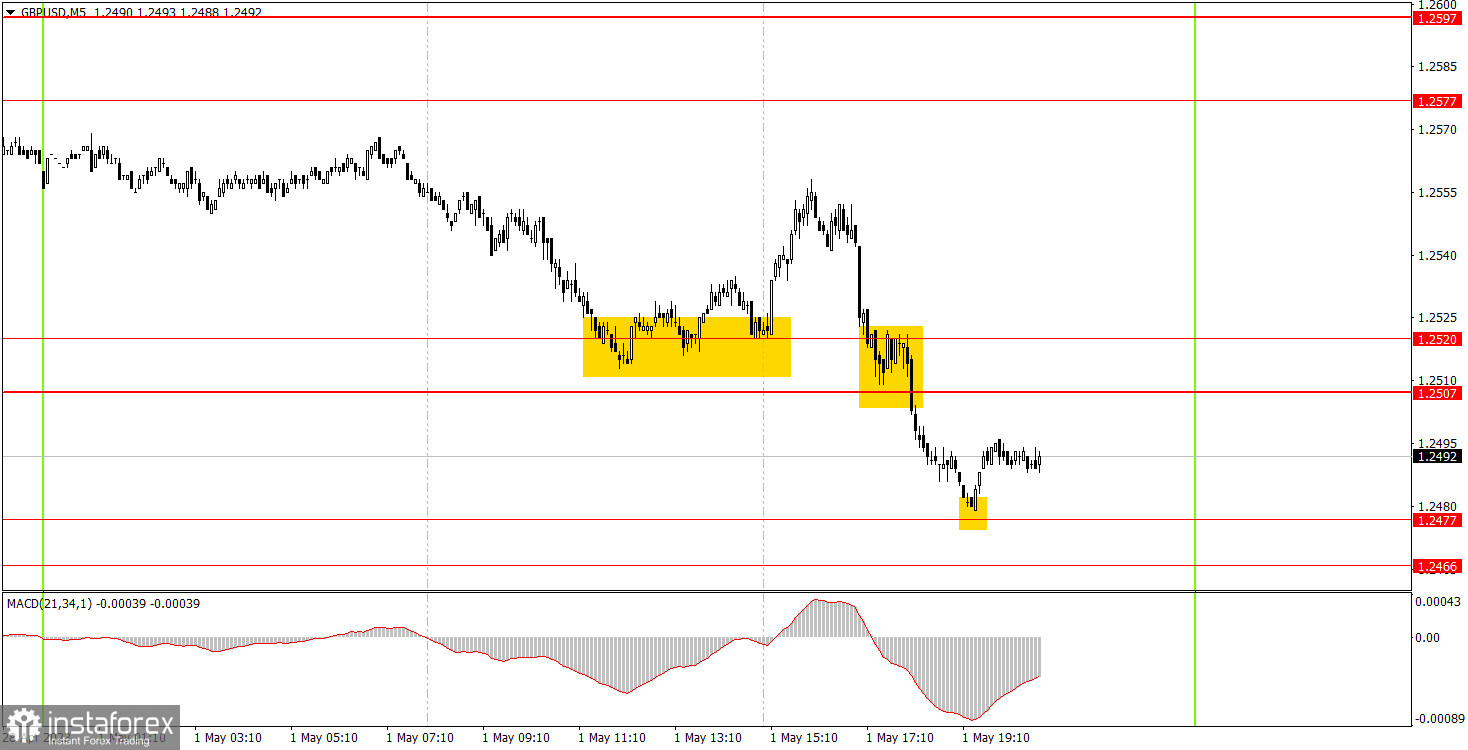
Trading signals on the 5-minute chart were not the best. In the first half of the day, the pair traded differently than the euro. A rebound from the area of 1.2507-1.2520 even provoked a small growth of 25 points. This movement made it possible for beginners to set a Stop Loss at breakeven for a long position, at which the deal was closed. Then, a breakthrough of the 1.2507-1.2520 area followed, which could be interpreted as a sell signal and traders could work it out. The nearest target was very close, so you could earn 10 points on a short position. The last buy signal should not have been worked out, as it was formed quite late in time.
Trading tips on Tuesday:
On the 30-minute chart, GBP/USD continues to trade higher in the medium-term perspective, or at least, it does not decline. Movements are mostly illogical, as is the market's reaction to fundamental and macroeconomic events. Nevertheless, overcoming the trend line will provide certain chances for the dollar to grow, but this week there will be important events that could return the pair to the ascending channel. On the 5-minute chart, you can trade at levels 1.2245-1.2260, 1.2343-1.2360, 1.2396, 1.2466-1.2477, 1.2507-1.2520, 1.2577-1.2597-1.2616, 1.2659-1.2674. As soon as the price passes 20 pips in the right direction, you should set a Stop Loss to breakeven. On Tuesday, the UK plans to publish its manufacturing PMI for April, and according to expert forecasts, this indicator may fall even more. Therefore, in the first half of the day, the pound may continue to fall. But do not forget about the eurozone inflation report, as the euro may pull the pound up or down with it. The JOLTs report in the US is also capable of provoking a market reaction.
Basic rules of the trading system:
1) The strength of the signal is determined by the time it took the signal to form (a rebound or a breakout of the level). The quicker it is formed, the stronger the signal is.
2) If two or more positions were opened near a certain level based on a false signal (which did not trigger a Take Profit or test the nearest target level), then all subsequent signals at this level should be ignored.
3) When trading flat, a pair can form multiple false signals or not form them at all. In any case, it is better to stop trading at the first sign of a flat movement.
4) Trades should be opened in the period between the start of the European session and the middle of the US trading hours when all positions must be closed manually.
5) You can trade using signals from the MACD indicator on the 30-minute time frame only amid strong volatility and a clear trend that should be confirmed by a trendline or a trend channel.
6) If two levels are located too close to each other (from 5 to 15 pips), they should be considered support and resistance levels.
On the chart:
Support and Resistance levels are the levels that serve as targets when buying or selling the pair. You can place Take Profit near these levels.
Red lines are channels or trend lines that display the current trend and show in which direction it is better to trade now.
The MACD indicator (14, 22, and 3) consists of a histogram and a signal line. When they cross, this is a signal to enter the market. It is recommended to use this indicator in combination with trend patterns (channels and trendlines).
Important announcements and economic reports that can be found on the economic calendar can seriously influence the trajectory of a currency pair. Therefore, at the time of their release, we recommend trading as carefully as possible or exiting the market in order to avoid sharp price fluctuations.
Beginners on Forex should remember that not every single trade has to be profitable. The development of a clear strategy and money management is the key to success in trading over a long period of time.


