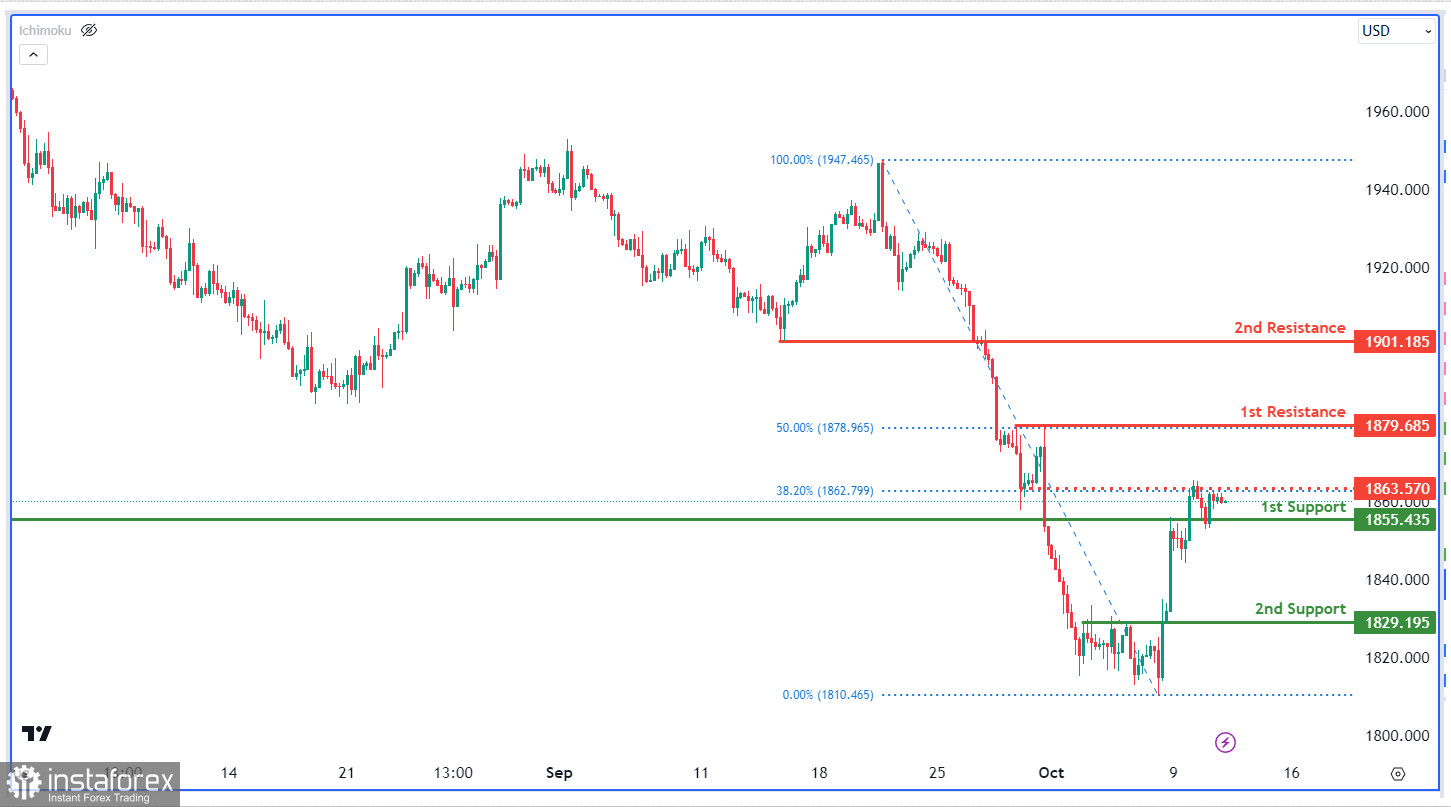
The XAU/USD chart currently exhibits a weak bullish momentum, with a potential scenario of a bullish continuation towards the 1st resistance level should price break above the intermediate resistance level.
The intermediate resistance level at 1,863.57 is identified as a pullback resistance that aligns with the 38.20% Fibonacci retracement level while the 1st resistance level at 1,879.69 is also noted as a pullback resistance that aligns with the 50.00% Fibonacci retracement level. Higher up, the 2nd resistance level at 1,901.19 is identified as a pullback resistance.
To the downside, the 1st support level at 1,855.44 is identified as a pullback support. Additionally, the 2nd support level at 1,829.19 is also marked as a pullback support.


