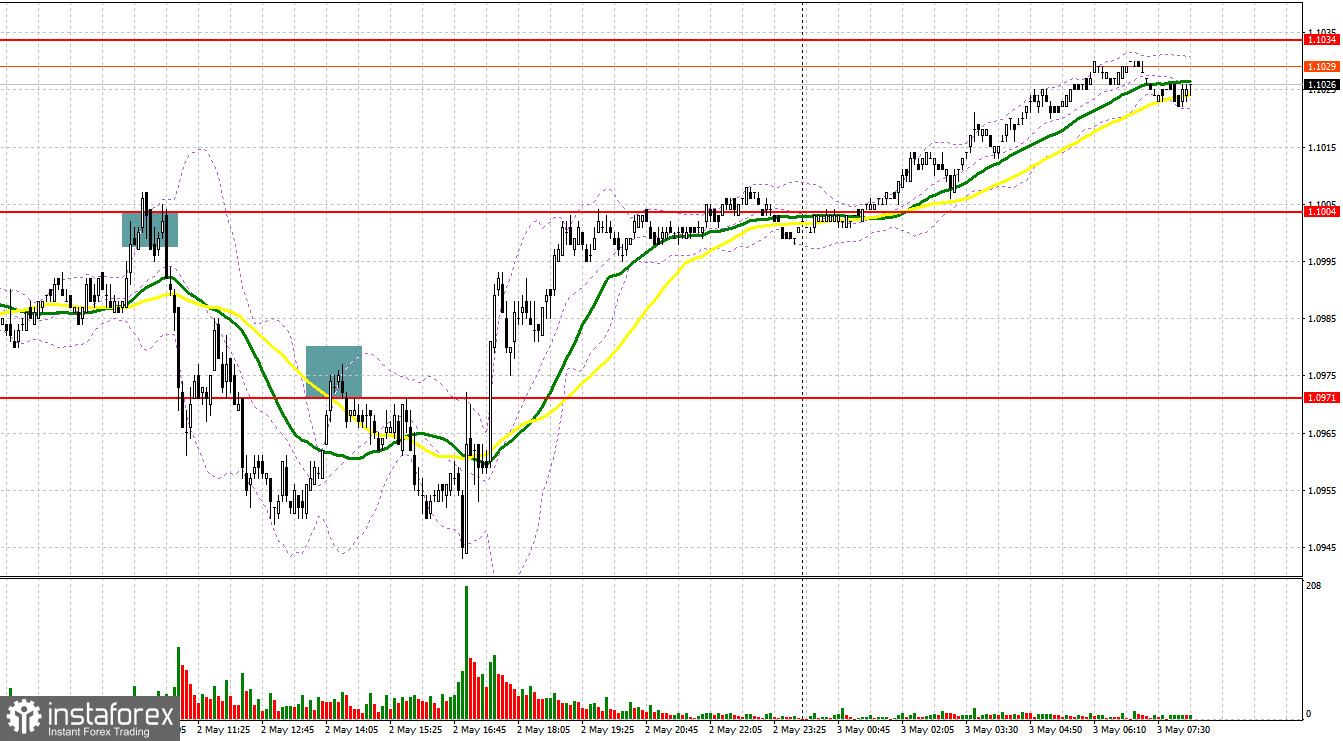
Several entry signals were made yesterday. Let's look at the 5-minute chart and see what happened. In my morning forecast, I considered entering the market at 1.0999. Growth and a false breakout at this level created an excellent sell entry point. The price dropped by more than 30 pips. Buyers tried hard to protect the level of 1.0967. A false breakout there produced a buy entry point. However, after a 16-pip rise, bullish activity decreased sharply. In the second half of the day, the price failed to consolidate above 1.0971. Another sell signal triggered a fall in price by more than 30 pips.

To open long positions on EUR/USD, you need:
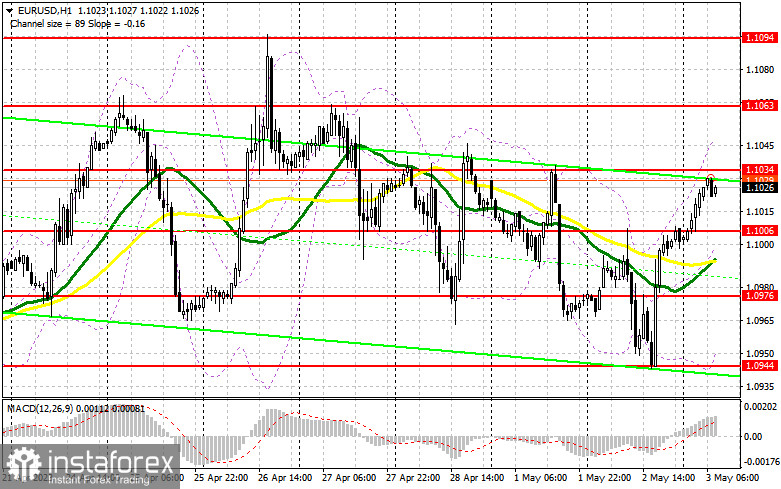
The focus today will be on the US macro statistics due in the second half of the day. So, I do not expect any significant volatility during the European session. The bulls will attempt to take the 1.1034 level under control after the release of unemployment data in the eurozone. However, the pair's upward potential is clearly limited by expectations of changes in US monetary policy. So, we should focus on the 1.1006 level, formed yesterday, and below which the bullish moving averages pass. A false breakout there will create a buy entry point, targeting the nearest resistance level of 1.1034. A breakout and a downside test of this range will strengthen bullish sentiment and create an additional buy entry point, targeting 1.1063. The most distant target is seen at 1.1094, where I am going to take profit. However, such growth can only be expected after the Federal Reserve's decision on interest rates.
In the case of a decline in EUR/USD and the absence of buyers at 1.1006, which is quite likely as there is nothing good to expect from eurozone data ahead, only a false breakout around the next support level of 1.0976 will make a buy signal. We may also open long positions at the 1.0944 low, allowing an upward correction of 30-35 pips intraday.
To open short positions on EUR/USD, you need:
Speculators continue to manipulate the market. The eurozone's unemployment data may trigger a positive reaction in the market. The bears may use this chance to enter short positions at favorable prices. Therefore, it is important to protect the resistance level of 1.1034. A false breakout through this level will give a sell signal, targeting 1.1006 – a new support level, formed yesterday. After consolidation below this range and an upside retest, the pair may drop to 1.0976. The most distant target stands at the low of 1.0944, where I am going to take profit.
In the case of an increase in EUR/USD during the European session and the absence of bears at 1.1034, buyers will likely try to continue yesterday's trend already in the first half of the day. In such a case, I will sell at the level of 1.1063 but only after failed consolidation. I will also open short positions at a high of 1.1094, allowing a bearish correction of 30-35 pips.


Indicator signals:
Moving averages
Trading is carried out above the 30-day and 50-day moving averages, which indicates that the bulls are trying to regain control over the market.
Note: The period and prices of moving averages are viewed by the author on the hourly chart and differ from the general definition of classic daily moving averages on the daily chart.
Bollinger Bands
Support stands at 1.0950, in line with the lower band.
Indicator description:
- Moving average (MA) determines the current trend by smoothing volatility and noise. Period 50. Colored yellow on the chart.
- Moving average (MA) determines the current trend by smoothing volatility and noise. Period 30. Colored green on the chart.
- Moving Average Convergence/Divergence (MACD). Fast EMA 12. Slow EMA 26. SMA 9.
- Bollinger Bands. Period 20
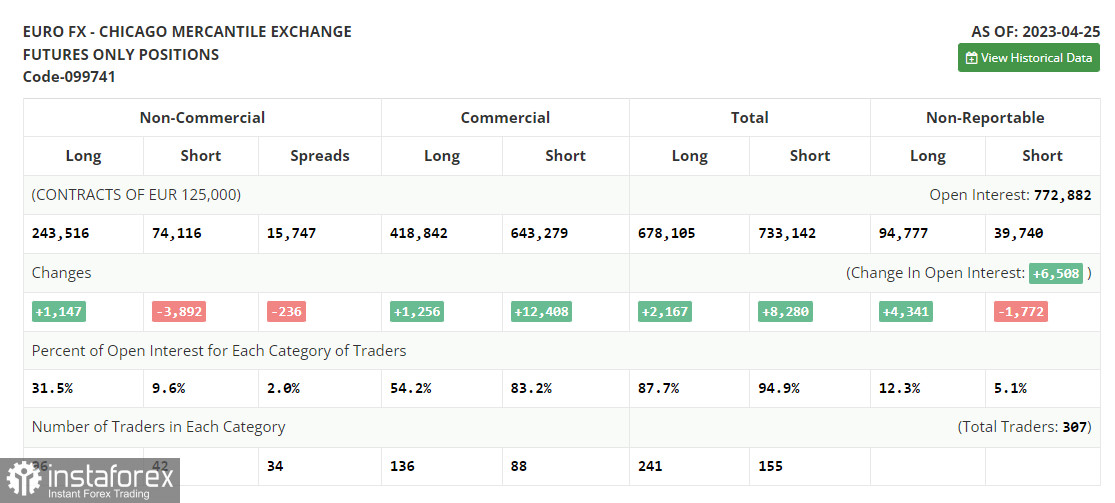
- Non-commercial traders are speculators such as individual traders, hedge funds, and large institutions who use the futures market for speculative purposes and meet certain requirements.
- Long non-commercial positions are the total long position of non-commercial traders.
- Non-commercial short positions are the total short position of non-commercial traders.
- Total non-commercial net position is the difference between the short and long positions of non-commercial traders.


