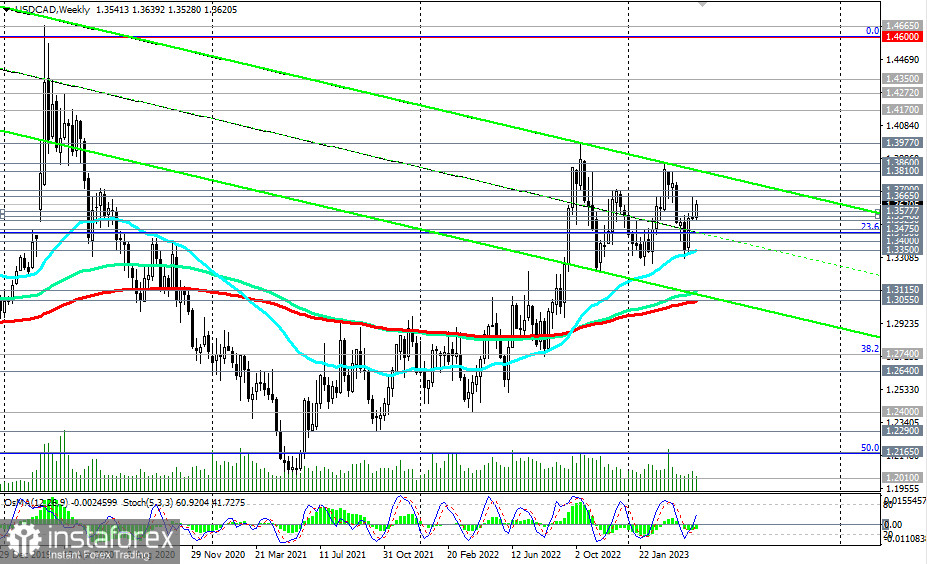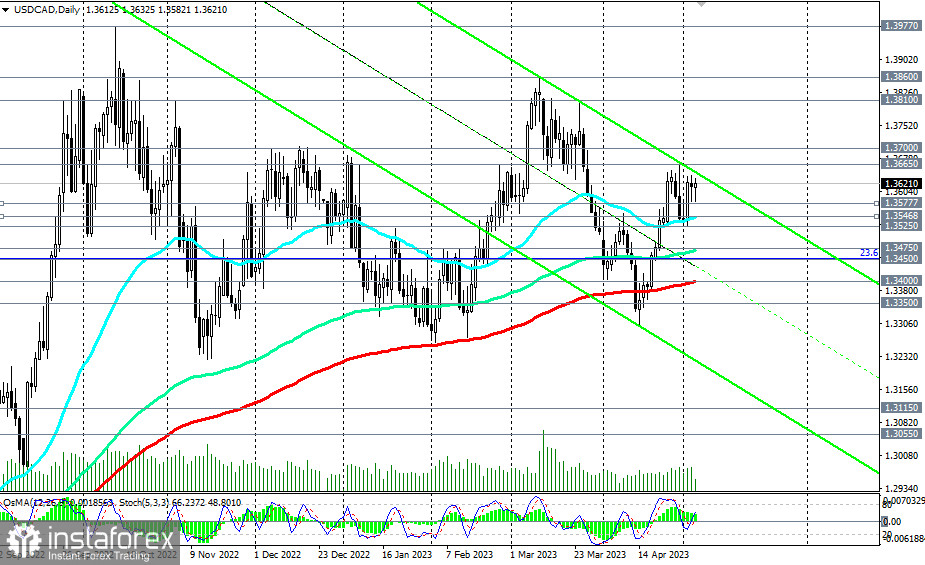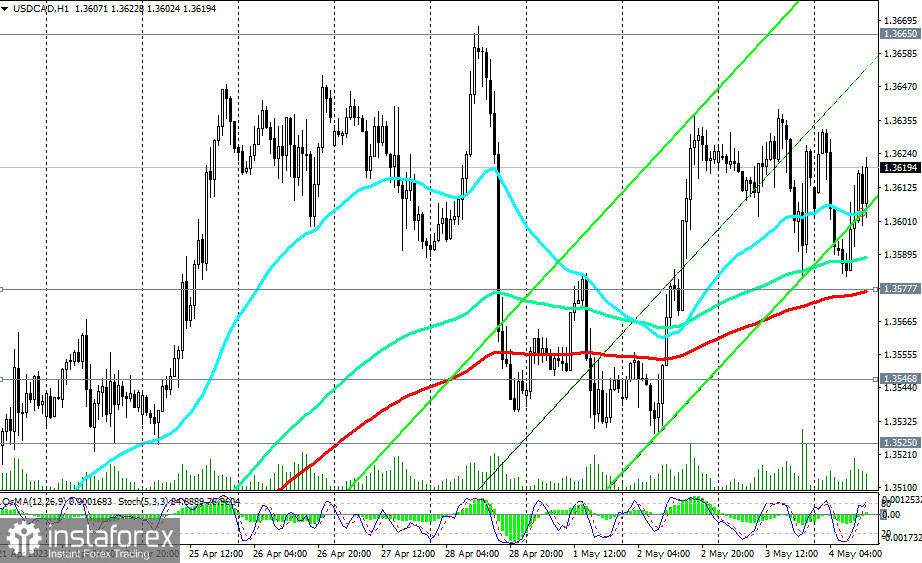
The overall long-term upward dynamics of USD/CAD are still preserved, and breaking through the local resistance levels 1.3665, 1.3700 will signal building long positions on the pair. In this case, USD/CAD will head towards the upper boundary of the downward channel on the weekly chart and to the levels of 1.3810, 1.3860. We are not considering growth above the 1.3977 mark (the October high and the highest level since June 2020) yet. A change in the overall downward dynamics of the U.S. dollar to the opposite is needed for this.

In the USD/CAD pair, as we have already noted, the upward dynamics prevail, primarily due to the weakness of the Canadian dollar.
In an alternative scenario, USD/CAD will resume its decline towards the key support levels 1.3475 (144 EMA on the daily chart), 1.3450 (23.6% Fibonacci retracement level in the last strong growth wave from the 0.9700 level to the 1.4600 level), 1.3400 (200 EMA on the daily chart). Above these levels, USD/CAD is trading in the zone of medium-term and long-term markets. The first signal for the downward movement is the breakdown of the support level 1.3577 (200 EMA on the 1-hour chart), and the confirming one is the breakdown of the supports at 1.3547 (200 EMA on the 4-hour chart and 50 EMA on the daily chart), 1.3525 (monthly lows).

As for the main news remaining this week regarding the USD/CAD pair, it is necessary to pay attention to tomorrow's publications at 12:30 (GMT) of the most important macro data for the U.S. and Canada.
Support levels: 1.3577, 1.3547, 1.3525, 1.3500, 1.3475, 1.3450, 1.3400, 1.3350
Resistance levels: 1.3665, 1.3700, 1.3810, 1.3860, 1.3900, 1.3970, 1.4000


