


Trend analysis
GBP/USD may continue moving upward this week, starting from the level of 1.2628 (closing of the last weekly candle) to 1.2781, which is a historical resistance level (blue dashed line). Upon reaching this price, the pair will continue rising to 1.2866, which is the 85.4% retracement level (blue dashed line).
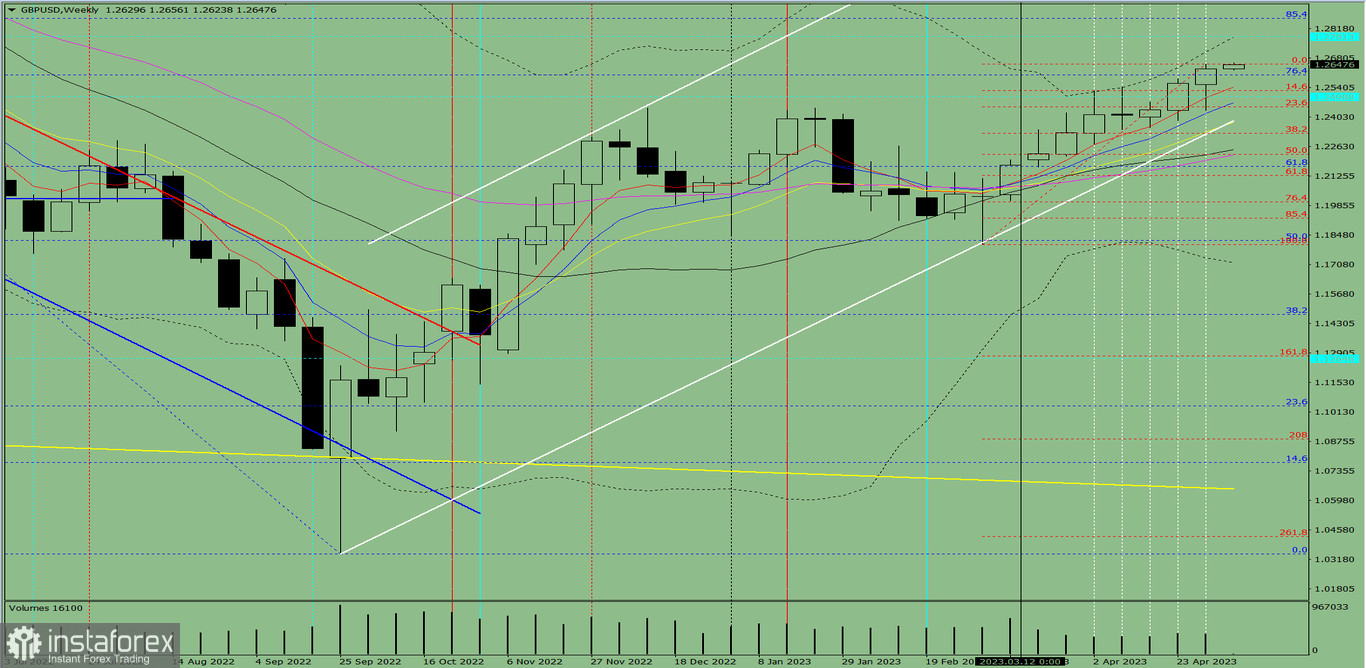
Fig. 1 (weekly chart)
Comprehensive analysis:
Indicator analysis - upward
Fibonacci levels - upward
Volumes - upward
Candlestick analysis - downward
Trend analysis - upward
Bollinger bands - upward
Monthly chart - upward
All these point to a downward movement in GBP/USD.
Conclusion: Most likely, the pair will have a bullish trend, with no first lower shadow on the weekly white candle (Monday - upward) and no second upper shadow (Friday - upward).
So during the week, pound may continue rising from the level of 1.2628 (closing of the last weekly candle) to the historical resistance level at 1.2781 (blue dashed line), and then head towards the 85.4% retracement level at 1.2866 (blue dashed line).
Alternatively, the quote could climb upward from 1.2628 (closing of last week's candle) to the historical resistance level at 1.2781 (blue dashed line), and then bounce down to the upper fractal at 1.2651 (red dashed line).


