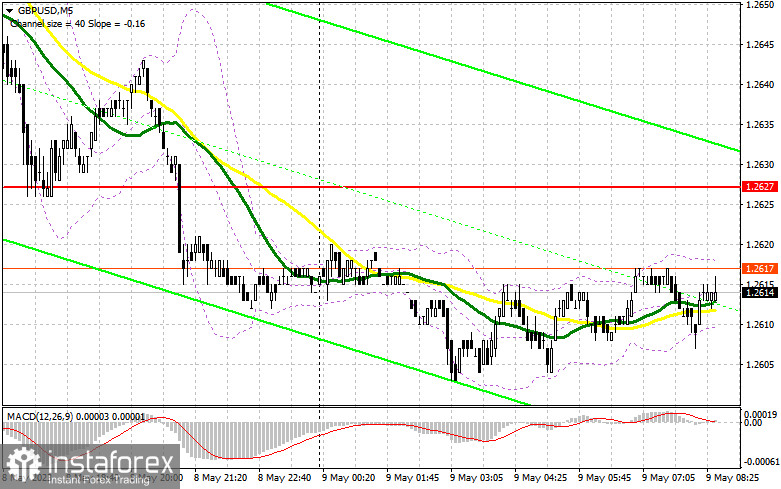
Yesterday, the pair did not form any entry signals. Let's have a look at the 5-minute chart and see what happened there. In my morning review, I mentioned the level of 1.2669 as a possible entry point. Yet, the pair failed to form any sell entry points there as it missed just a few pips to reach this level.

For long positions on GBP/USD
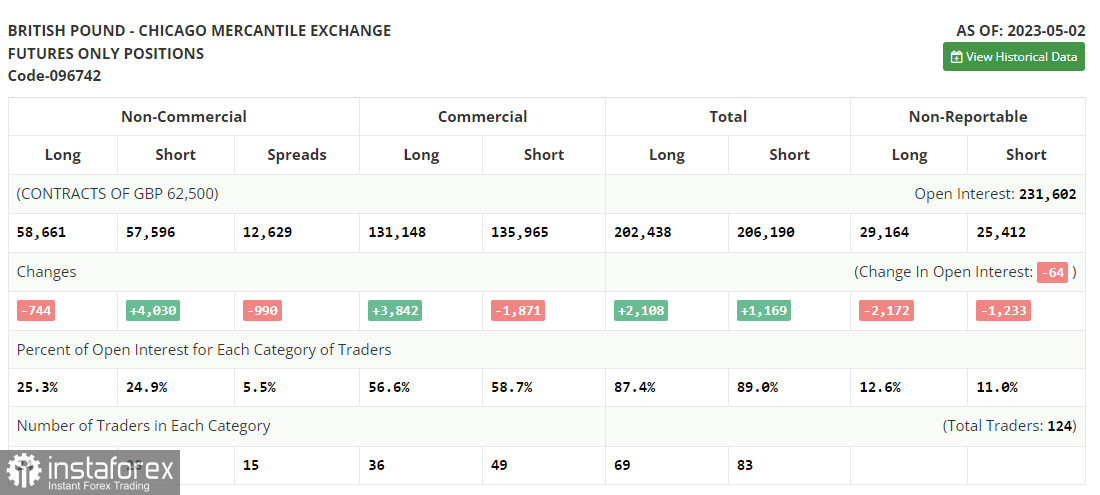
Before proceeding with technical analysis, let us first discuss the futures market. The Commitments of Traders report for May 2 recorded a rise in short positions and a fall in the long ones. Markets are sure that the Bank of England will have to follow suit of other central banks and continue to raise interest rates. The fight against inflation in the UK is far from being over, especially given that the regulator has not reached any impressive results after a year of consecutive rate hikes. The British pound is unlikely to advance on a 25-basis-point rate increase as this scenario has already been priced in by the market. So, we shouldn't be surprised to see even a deeper correction this week. According to the latest COT report, short positions of the non-commercial group of traders went up by 4,030 to 57,596, while long positions declined by 744 to 58,661. As a result, the non-commercial net position decreased to 1,065 against 5,839 from a week ago. This is the first decline in six weeks so it can be viewed as a common correction. The weekly closing price advanced to 1.2481 from 1.2421.
The pound buyers will most likely try to regain control of the market. However, it is not recommended to go long right now as the current correction may continue ahead of the BoE's policy meeting. It would be wise to buy on a correction today. Besides, apart from the Halifax house price index, no more important reports are expected in the UK on Tuesday.

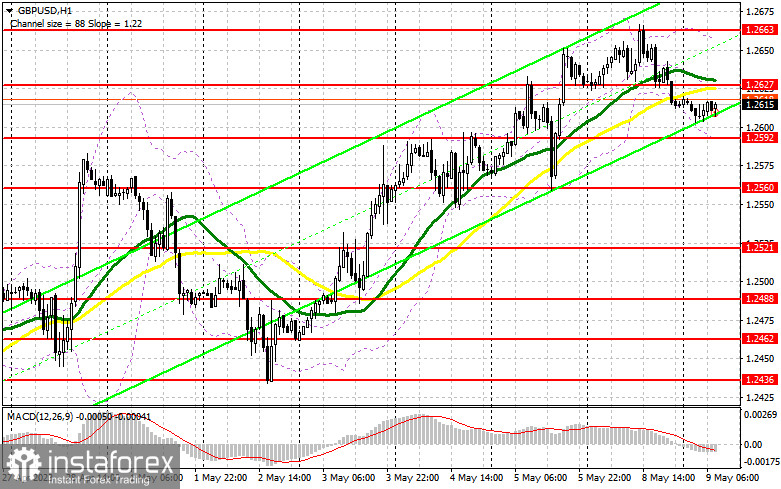
I will focus on the nearest support at 1.2592 as its breakout may change the situation in the market. If the data comes in worse than expected, the pound will again come under pressure, and bulls will get a chance to assert their strength. A false breakout at 1.2592 will serve as a good buy signal and will send GBP/USD towards 1.2627. This is where moving averages support the bears. A breakout and a downward test of this range will generate another buy signal. If so, the pair may resume the bullish trend and retest the level of 1.2663. Without reaching this level, bulls will struggle to develop a further uptrend. If the price moves above this range, it may well head for the new target at 1.2709 where I will be taking profit.
If GBP/USD declines and bulls are idle at 1.2592, the pound will stay under pressure. In this case, I would recommend going long only when the price hits the level of 1.2560. I will buy at this point only after a false breakout. Long positions on GBP/USD can be opened right after a rebound from 1.2521, keeping in mind an intraday correction of 30-35 pips.
For short positions on GBP/USD
Bears may not dominate the market, but they are attempting to restore balance after a significant bullish rally in early May. It is likely that bulls will try to break through the resistance level of 1.2627, especially in the case of positive UK data. So sellers need to do their best to stay at this level. Only the formation of a false breakout at this level will generate a sell signal with a possible decline to the nearest support at 1.2592 where strong activity is expected. A breakout and an upward retest of this range will provide an entry point for sell positions, with a new low at 1.2560. This will allow sellers to strengthen the short-term corrective trend. The next target will be the 1.2521 area where I will be taking profit.
If GBP/USD goes up and bears are idle at 1.2627, which is also quite likely given the medium-term advantage of the bulls, the situation will stabilize following yesterday's decline, and bears will no longer have such control over the market. In this case, only a false breakout around the next resistance level of 1.2663 will form an entry point for short positions with a possible downward movement of the pound. If nothing happens there as well, it is advisable to sell GBP/USD at 1.2709, anticipating a downward pullback of the pair by 30-35 points within the day.

Indicator signals:
Moving Averages
Trading below the 30- and 50-day moving averages indicates a bearish market.
Please note that the time period and levels of the moving averages are analyzed only for the H1 chart, which differs from the general definition of the classic daily moving averages on the D1 chart.
Bollinger Bands
If the pair rises, the upper band of the indicator at 1.2655 will act as resistance. If the pair declines, the lower band of the indicator at 1.2592 will serve as support.
Description of indicators:
• A moving average of a 50-day period determines the current trend by smoothing volatility and noise; marked in yellow on the chart;
• A moving average of a 30-day period determines the current trend by smoothing volatility and noise; marked in green on the chart;
• MACD Indicator (Moving Average Convergence/Divergence) Fast EMA with a 12-day period; Slow EMA with a 26-day period. SMA with a 9-day period;
• Bollinger Bands: 20-day period;
• Non-commercial traders are speculators such as individual traders, hedge funds, and large institutions who use the futures market for speculative purposes and meet certain requirements;
• Long non-commercial positions represent the total number of long positions opened by non-commercial traders;
• Short non-commercial positions represent the total number of short positions opened by non-commercial traders;
• The non-commercial net position is the difference between short and long positions of non-commercial traders.


