


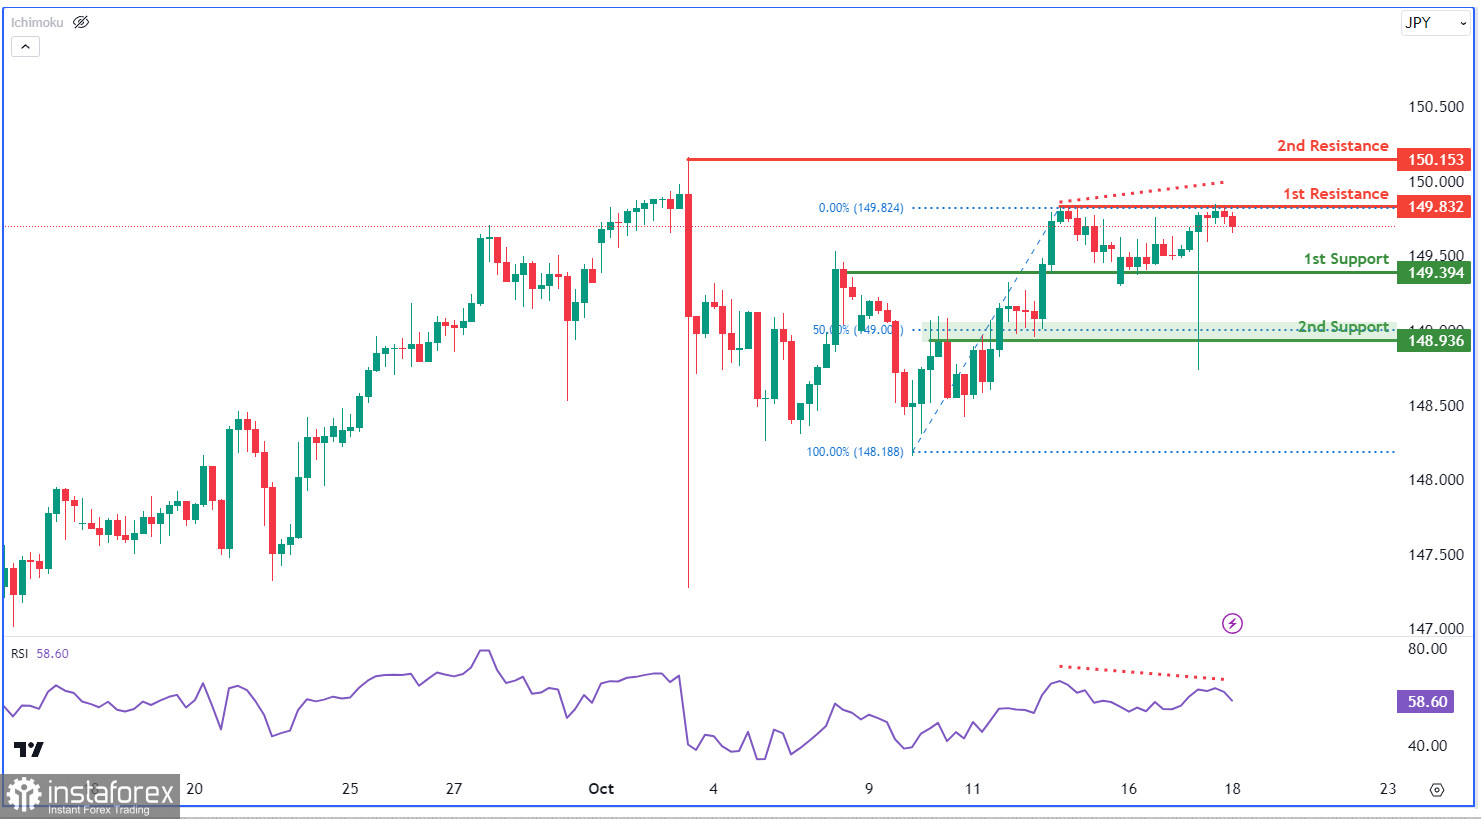
The USD/JPY chart currently shows bearish momentum, indicating the potential for a bearish reaction at the 1st resistance level, followed by a decline towards the 1st support level. The 1st support at 149.39 is significant as it aligns with an overlap support, while the 2nd support at 148.93 is also an overlap support and coincides with the 50% Fibonacci Retracement level, strengthening its potential as a support zone. On the resistance side, the 1st resistance at 149.83 is a multi-swing high resistance, and the 2nd resistance at 150.15 is a swing high resistance.
Additionally, the RSI (Relative Strength Index) displays bearish divergence with the price, indicating a possible reversal, which could further support the likelihood of a bearish reaction at the 1st resistance level.


