


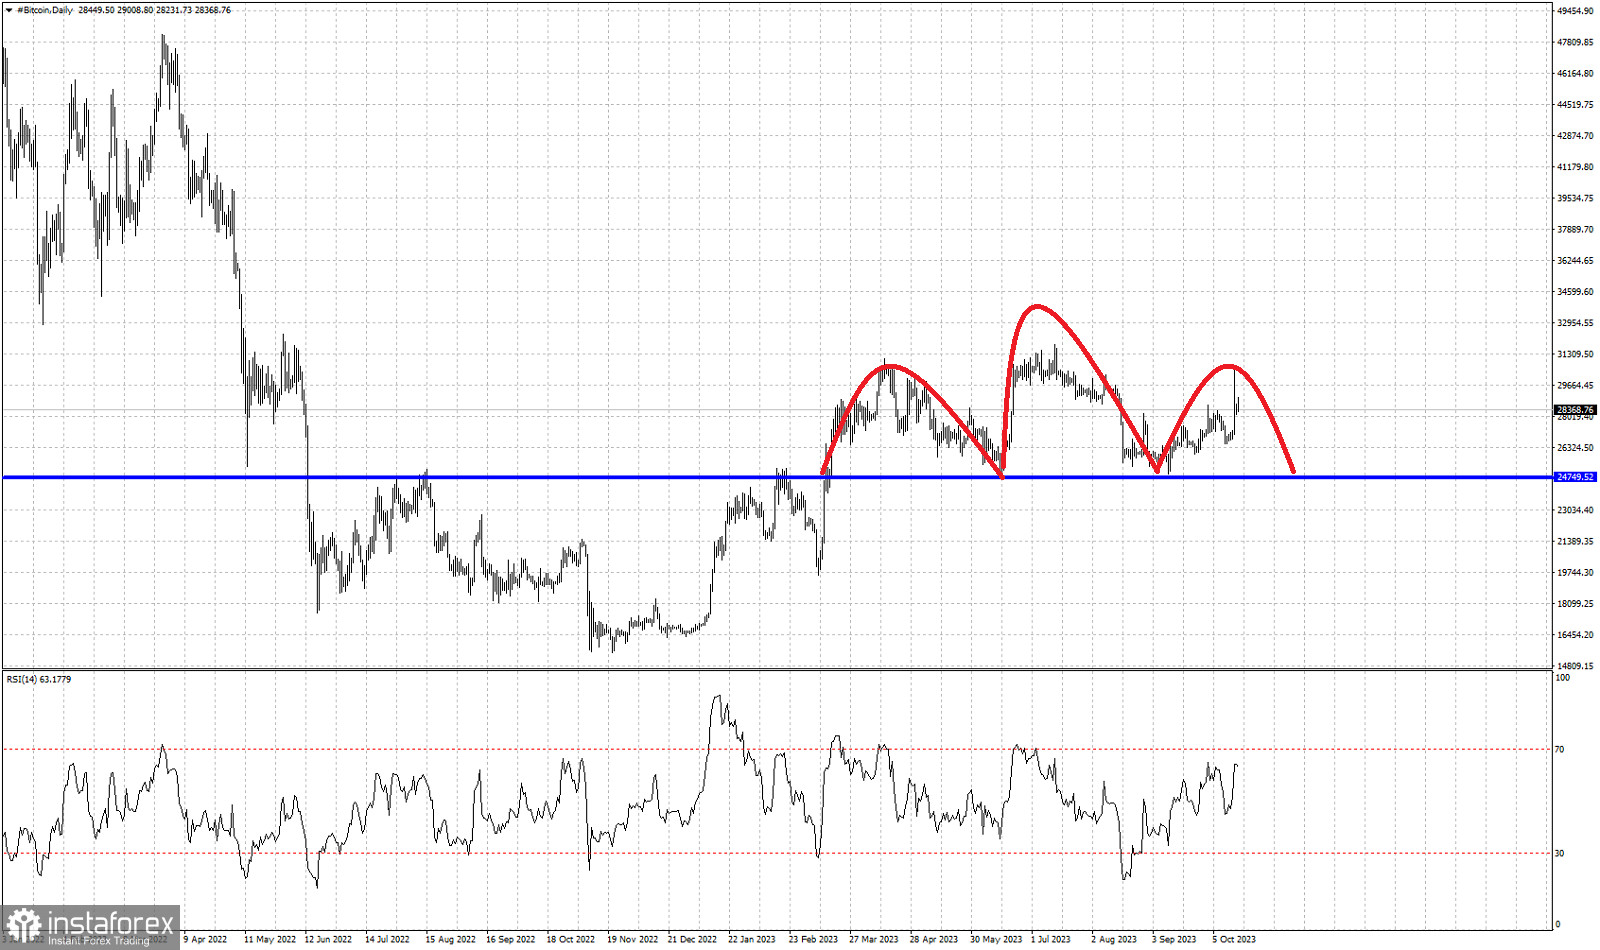
Red lines- head and shoulders pattern
Blue line- neckline support
Bitcoin is trading around $28,350 making higher highs and higher lows after the recent low at $25,077. There is a potential Head and Shoulders pattern under formation and maybe we are currently on the right hand shoulder. If price turns lower from current levels towards recent lows, then this pattern will most probably be true. The blue horizontal line is the neckline support that if broken will activate the target of this bearish pattern. So a break below the blue line would be an added bearish signal. For now Bitcoin has formed a lower high at $30,529. Bulls need to push above this level in order to decrease the chances of the bearish pattern playing out. Short-term support is also found at $26,540. A break below this level will most certainly push price towards the blue horizontal support level.


