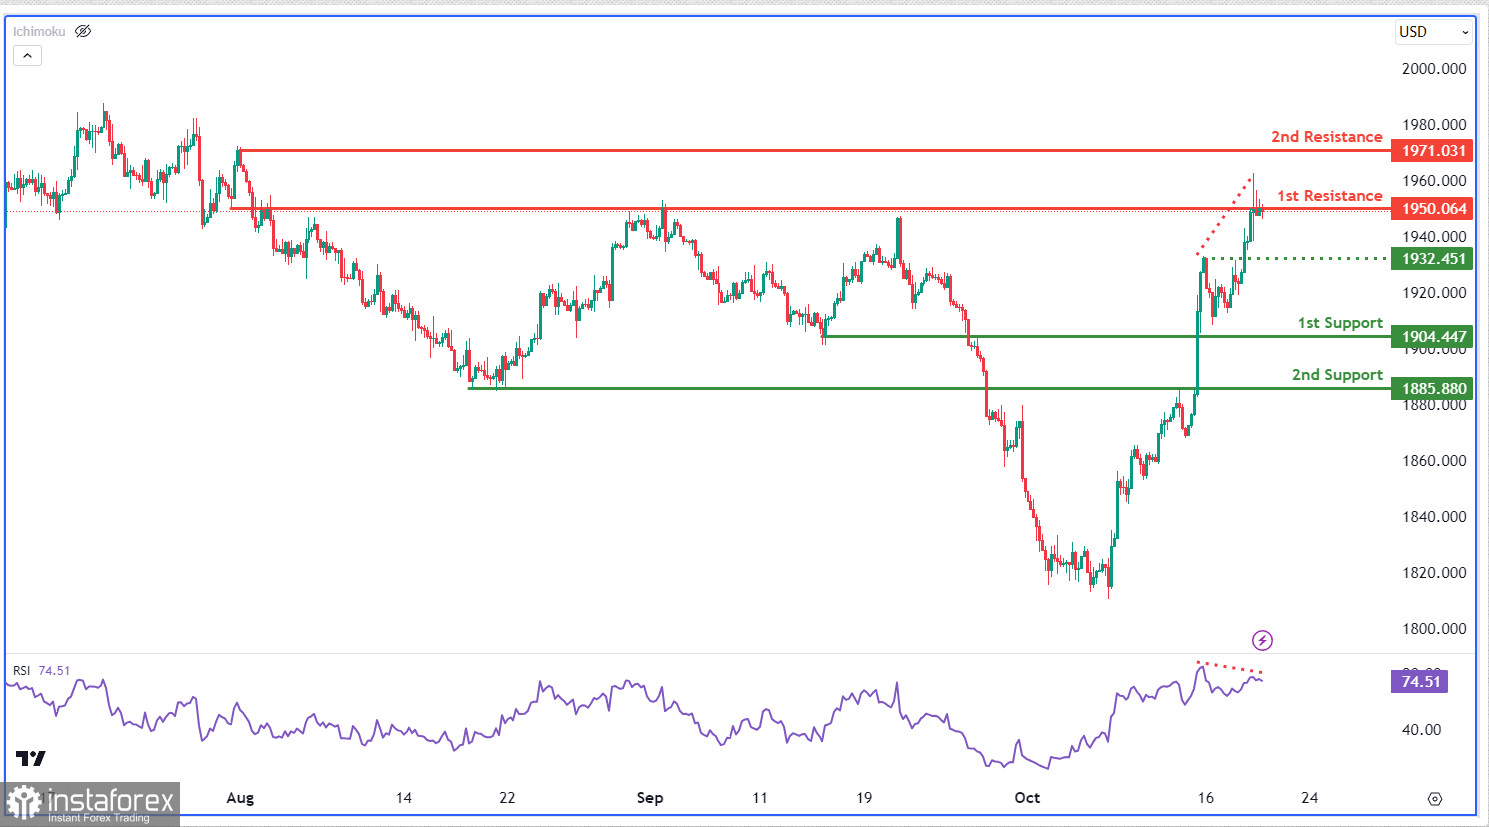
The XAU/USD chart currently shows bearish momentum, with a potential bearish reaction at the first resistance level, aiming for the first support. The first support at 1904.44 aligns with a pullback support, while the second support at 1885.88 is also a pullback support.
On the resistance side, the first resistance at 1950.06 is an overlap resistance, coinciding with the 161.80% Fibonacci Retracement level, indicating strong potential resistance. The second resistance at 1071.00 is a swing high resistance. Bearish divergence in the RSI suggests a possible upcoming reversal.


