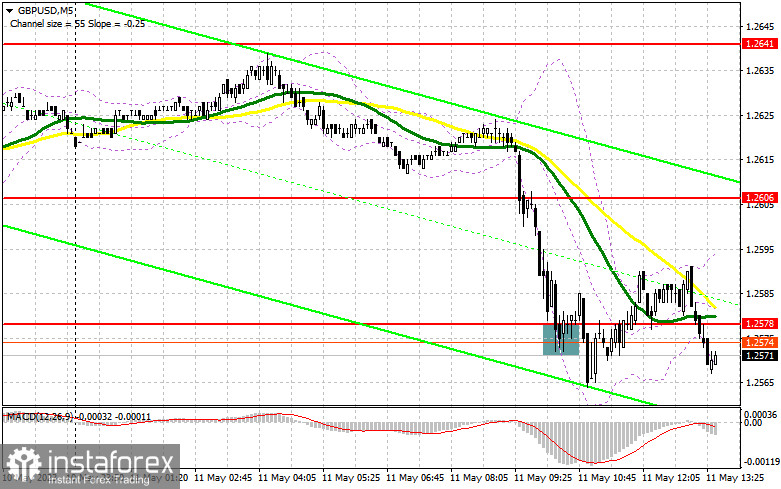
In my morning forecast, I focused on the 1.2578 level and recommended making market entry decisions from it. Let's look at the 5-minute chart and figure out what happened there. This level's decline and false breakout provided a great entry point for long positions, but the pair did not grow significantly. I decided not to leave open positions in anticipation of the Bank of England's decision, so I closed the trades at break-even. The technical picture changed a bit for the second half of the day.

To open long positions on GBP/USD, it is required:
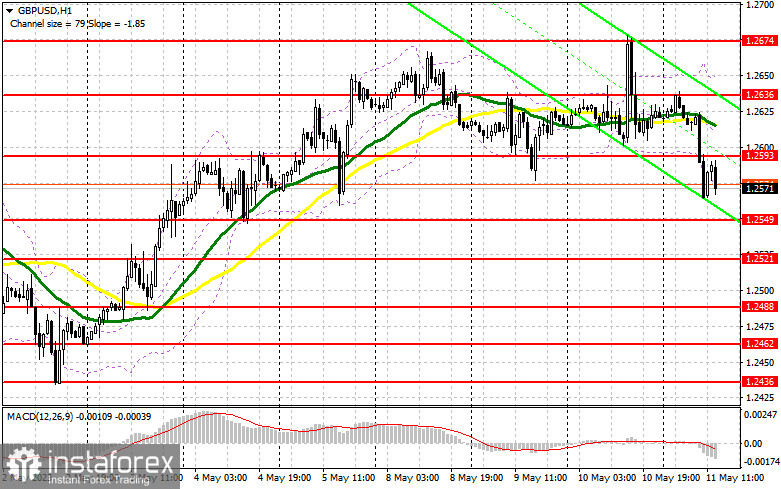
A lot depends on the Bank of England. The lack of aggression in Andrew Bailey's words and the decision to pause rate hikes for the time being will negatively impact the pound, leading to its further sell-off in the second half of the day. US data will be of secondary importance, but if the situation in the labor market improves, the pressure on GBP/USD will only increase. For this reason, I will not rush to open long positions. I plan to act on the decline from the nearest support at 1.2549. Forming a false breakout there will provide a buy signal with the prospect of recovery to the area of 1.2593, a new resistance level formed during the first half of the day. A breakthrough and consolidation above this range against the Bank of England's tough stance on interest rates will provide an additional buy signal with a jump to 1.2636. The furthest target will be the 1.2674 area, where I will fix the profit.
In a scenario of a decline to 1.2549 and the absence of buyer activity in the second half of the day, and for this, it will be enough for the Bank of England to loosen its hawkish grip, I will delay purchases until a larger level of 1.2521. I will only open long positions there on a false breakout. I plan to buy GBP/USD immediately on a rebound only from the minimum of 1.2488, with a correction target of 30-35 points within the day.
To open short positions on GBP/USD, it is required:
Sellers showed themselves in the first half of the day and hoped for a continuation of the pound's fall. If the Bank of England does not surprise traders, the pound will have a chance for a new downward surge. But a much more attractive scenario will be sales on the formation of a false breakout at the level of 1.2593. This will provide a chance to return pressure on GBP/USD with the prospect of a decline to 1.2549. A breakthrough and a bottom-up retest of this range will increase pressure on the pound, forming a sell signal with a fall to 1.2521. The furthest target remains the minimum of 1.2488, where I will fix the profit.

In the event of GBP/USD growth and lack of activity at 1.2593, which is likely, as everyone is waiting for new rate hikes by the Bank of England, postpone sales until the test of the new maximum of 1.2636. Only a false breakout there will provide a point of entry into short positions. If there's no downward movement, I'll be selling GBP/USD on a rebound immediately from 1.2674, but only in anticipation of a pair's correction down by 30-35 points within the day.
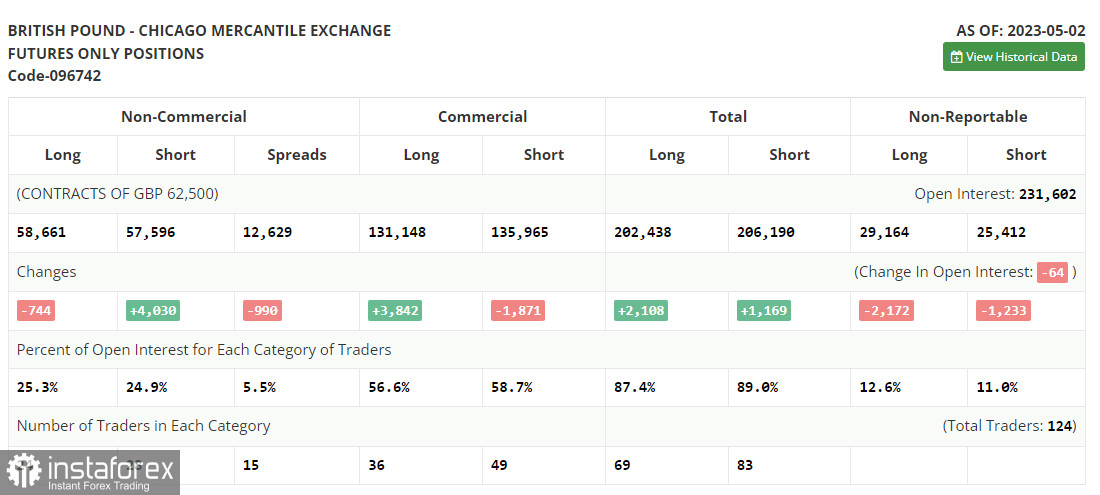
In the COT report (Commitment of Traders) for May 2, there was a growth in short positions and a reduction in long ones. Everyone understands that this week the Bank of England has nowhere to run and will have to follow other central banks in raising interest rates. The fight against inflation in the UK will continue for quite a long time, especially considering that the regulator has not achieved any positive results from the rate hike over the year. The pound is unlikely to react with growth to a rate increase of 0.25%, as this is already factored into the quotes, so do not be surprised if the pair demonstrates a deeper correction this week. The latest COT report states that non-commercial short positions increased by 4,030 to 57,596, while non-commercial long positions fell by 744 to 58,661. This led to a decrease in the non-commercial net position to 1,065 against 5,839 a week earlier. This is the first decrease in six weeks, so it can be considered a usual correction. The weekly price rose and amounted to 1.2481 against 1.2421.

Indicator signals:
Moving averages
Trading is conducted below the 30 and 50-day moving averages, indicating further pound depreciation.
Note: The author considers the period and prices of moving averages on the hourly chart H1 and differ from the general definition of classical daily moving averages on the daily chart D1.
Bollinger Bands
In case of growth, the upper border of the indicator around 1.2655 will act as resistance.
Indicator description
• Moving average (determines the current trend by smoothing out volatility and noise). Period 50. Marked in yellow on the chart.
• Moving average (determines the current trend by smoothing out volatility and noise). Period 30. Marked in green on the chart.
• MACD indicator (Moving Average Convergence/Divergence). Fast EMA period 12. Slow EMA period 26. SMA period 9
• Bollinger Bands. Period 20
• Non-commercial traders - speculators such as individual traders, hedge funds, and large institutions that use the futures market for speculative purposes and meet certain requirements.
• Non-commercial long positions represent the total long open position of non-commercial traders.
• Non-commercial short positions represent the total short open position of non-commercial traders.
• The total non-commercial net position is the difference between the short and long positions of non-commercial traders.


