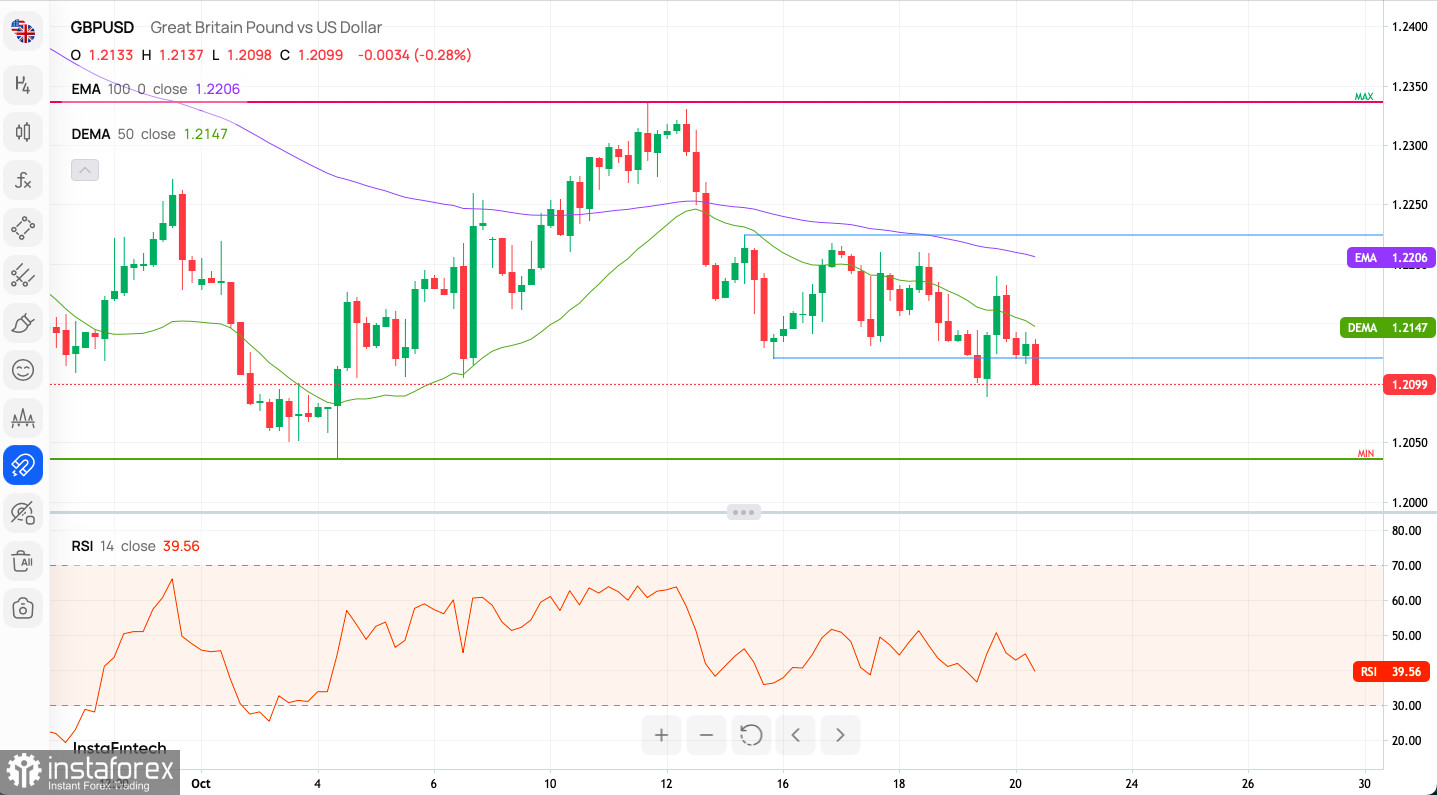
Technical Market Outlook:
The GBP/USD pair had broken out from a narrow zone located between the levels of 1.2121 - 1.2224 and made a new local low at the level of 1.2090. The bulls managed to pull-back up, but the market is again testing this level. The intraday technical support is still located at the level of 1.2036 and the intraday technical resistance is located at 1.2121. Please notice, that the mid-term outlook remains bearish due to the Bearish Cross of 50 and 100 DMA on the daily time frame chart. The weak and negative momentum on the H4 time frame chart supports the bearish outlook.

Weekly Pivot Points:
WR3 - 1.21913
WR2 - 1.21735
WR1 - 1.21667
Weekly Pivot - 1.21557
WS1 - 1.21489
WS2 - 1.21379
WS3 - 1.21201
Trading Outlook:
The bulls were rejected at the key technical resistance located at the level of 1.3163 and a breakout above this level is needed to extend the up trend towards the last Weekly swing high seen at 1.4248. The weekly time frame chart shows the Bearish Engulfing candlestick pattern was made during the breakout attempt above the 1.3163, so now the bears are in charge of the market. Any sustained breakout below the technical support seen at the level of 1.1802 would dramatically increase the chances of another leg down towards the level of 1.1494.


