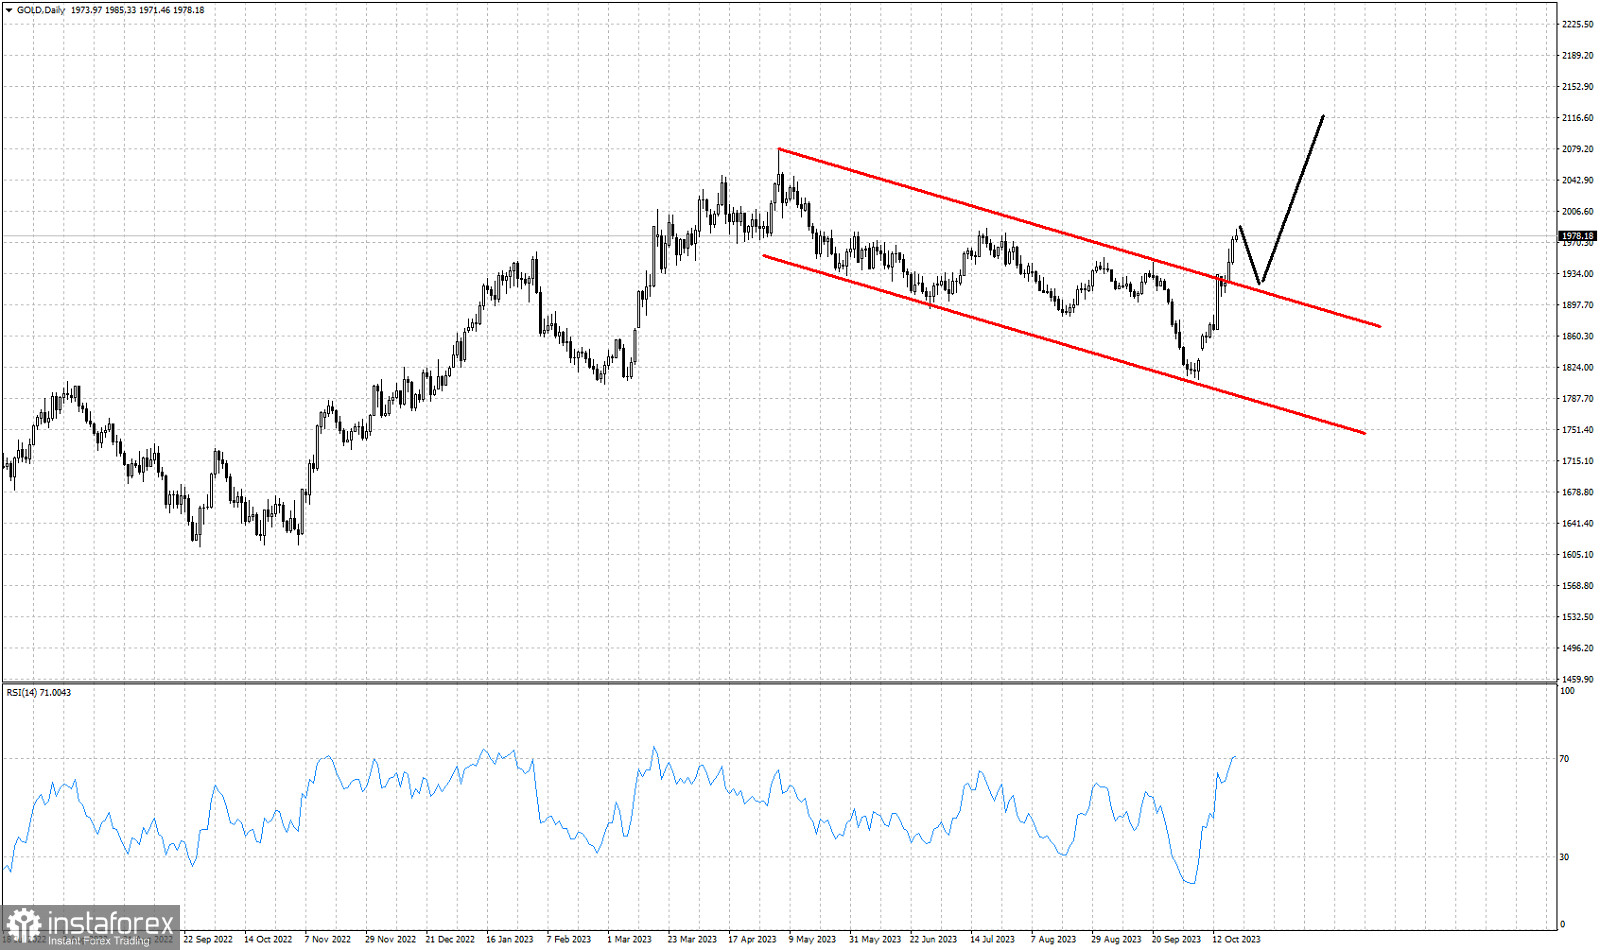
Red lines- bearish channel
Black lines- expected price path
Gold price is trading around $1,982 continuing its impressive bull run for a second week as price has managed to gain more than $150 in two weeks. As we mentioned in our previous post Gold price has also broken above the red downward sloping channel it was in since May. On a daily basis the RSI has now reached overbought levels. This is not a reversal signal. The RSI has made new higher highs as price is making higher highs also. The RSI price action suggests that we should look to be buyers on a pull back when it comes. Usually after break outs above bearish channels, we see back tests of the upper channel boundary. Our expectation is to see Gold price pull back in the area between $1,930 and $1,900 and then bounce back up to new highs. For now bulls remain in full control of the trend.


