


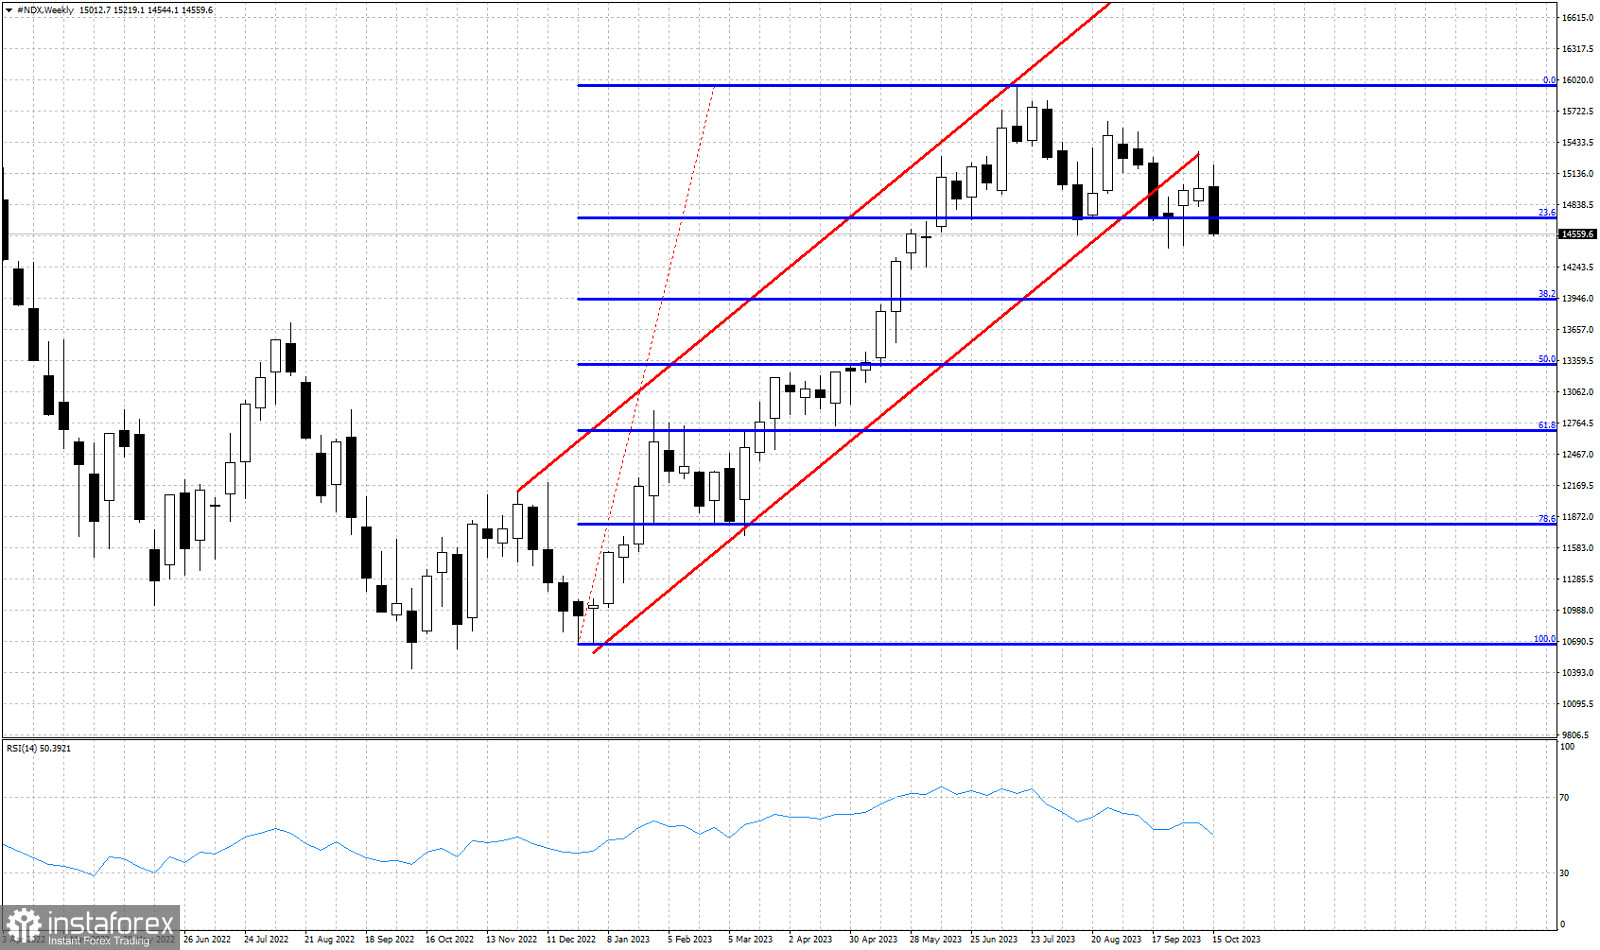
Red lines- bullish channel
Blue lines- Fibonacci retracement
New weekly low on a closing basis for Nasdaq since June 2023. Price recently broke out of the bullish channel it was in and for the last three weeks is was consolidating around 15,000 and 14,700. The weekly close found Nasdaq at new lows below the 23.6% Fibonacci retracement. Last week the index formed a lower high at 15,343 and this week the close broke below the weekly close of the last 9 weeks. As long as we trade below last week's lows price will remain vulnerable to the downside with next downside target the 38% Fibonacci retracement at 13,940-14,000.


