


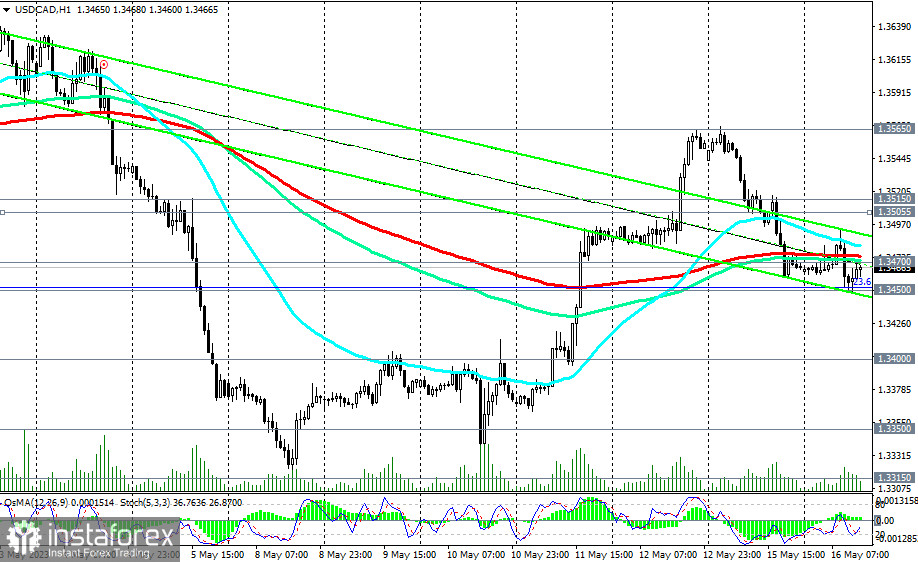
A significant increase in USD/CAD volatility is expected today at 12:30 (GMT). Above the key support levels 1.3400 (200 EMA on the daily chart), 1.3350 (50 EMA on the weekly chart), the long-term upward trend of the pair is preserved, and the breakout of the resistance levels 1.3505 (200 EMA on the 4-hour chart), 1.3515 (50 EMA on the daily chart) will be a signal to increase the long positions on the pair.
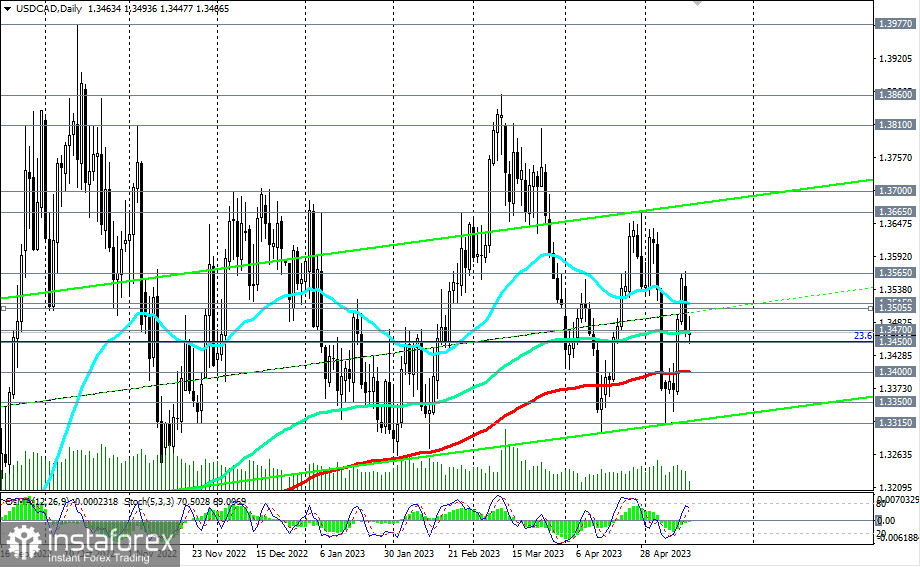
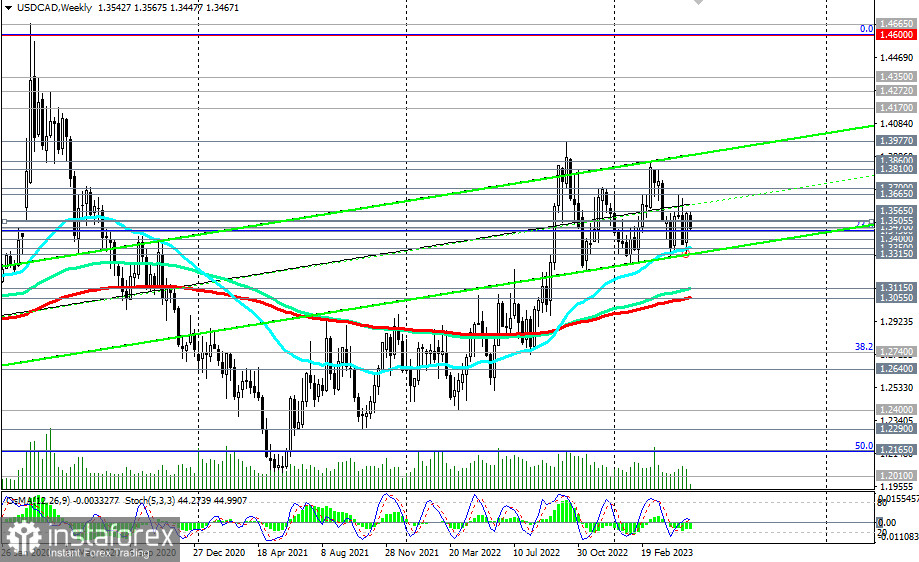
In this case, USD/CAD will move towards the upper boundary of the upward channel on the weekly chart and towards the levels of 1.3810, 1.3860, and after their breakout—towards 1.3977 (October high and high since June 2020). The first signal for the implementation of this scenario will be a breakout of the 1.3470 resistance level (200 EMA on the 1-hour chart and 144 EMA on the daily chart).
In the alternative scenario, USD/CAD will resume its decline towards the key support levels 1.3400, 1.3350 and the local support level 1.3315.
Their breakdown, in turn, will increase the risks of breaking the lower boundary of the established range between the levels of 1.3300 and 1.3700 and further decline to the key support levels 1.3115 (144 EMA on the weekly chart), 1.3055 (200 EMA on the weekly chart), separating the long-term bull market from the bearish one.
Support levels: 1.3450, 1.3400, 1.3350, 1.3315
Resistance levels: 1.3470, 1.3505, 1.3515, 1.3565, 1.3600, 1.3665, 1.3700, 1.3810, 1.3860, 1.3900, 1.3970, 1.4000


