


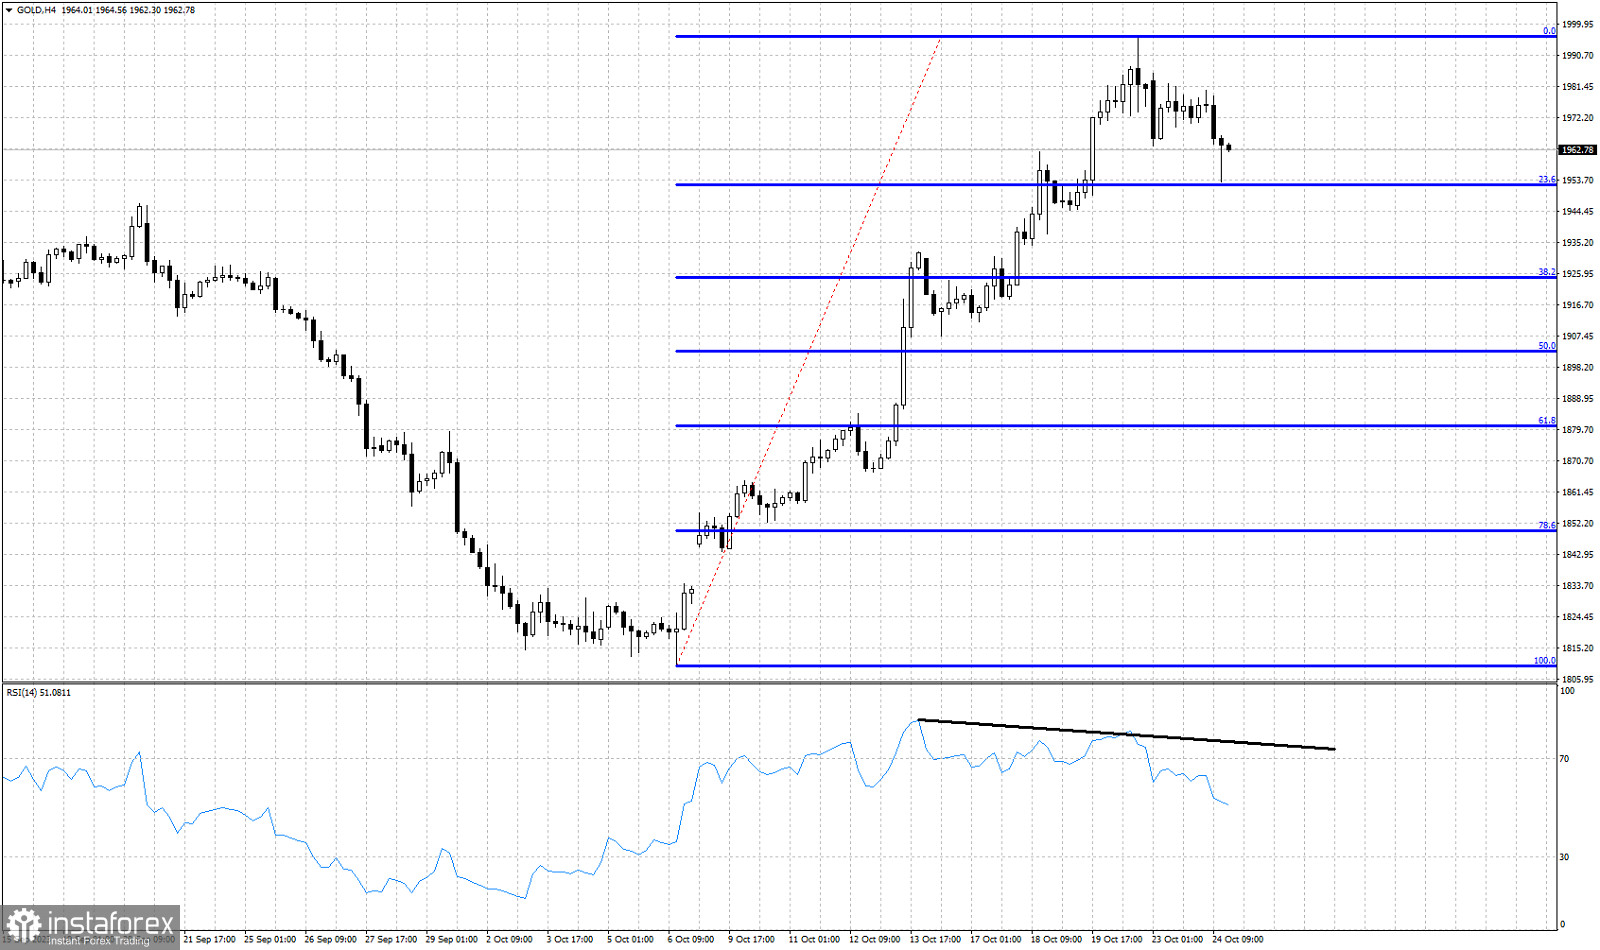
Blue lines- Fibonacci retracement levels
Black line- bearish RSI divergence
Gold price is trading around $1,964. Gold made a new lower low earlier today around $1,953 where we find the 23.6% Fibonacci retracement of the entire upward move from $1,809. Short-term trend remains bullish despite the recent pull back. This can just be a pause to the entire upward wave. However if Gold breaks below today's lows, the chances for a deeper corrective pull back will increase. Recently the RSI provided a bearish divergence signal as we mentioned in our previous post. This is not a reversal signal but only a warning. Price has started making lower lows and lower highs. Short-term resistance is found at $1,982. As long as price is below this level, Gold will remain vulnerable to more downside. A break above this level will open the way for new higher highs towards $2,000.


