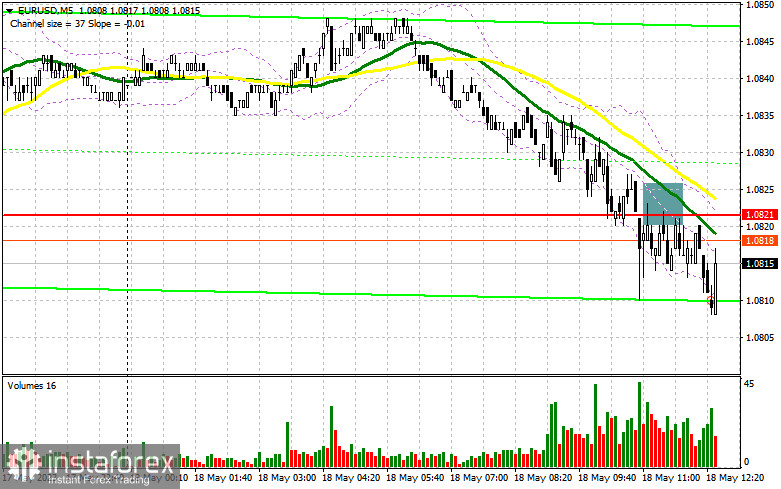
In my morning forecast, I focused on the level of 1.0821 and suggested making market entry decisions from this point. Let's look at the 5-minute chart and figure out what happened there. The breakout and retest of this level occurred, leading to a sell signal. However, at the time of writing this article, amid low trading volume, the major fall of the euro had not happened. The technical picture for the second half of the day still needs to be revised.

Requirements to open long positions on EUR/USD:
Without important fundamental statistics and low trading volume, only a few want to buy the euro, even at new weekly lows. However, bulls can make themselves known anytime, taking advantage of the American economy's data. Weekly numbers for initial jobless claims, the Philadelphia Fed manufacturing index, and home sales volume in the secondary market are expected. The latter indicator will interest us the most, as its reduction may negatively affect the dollar's position.
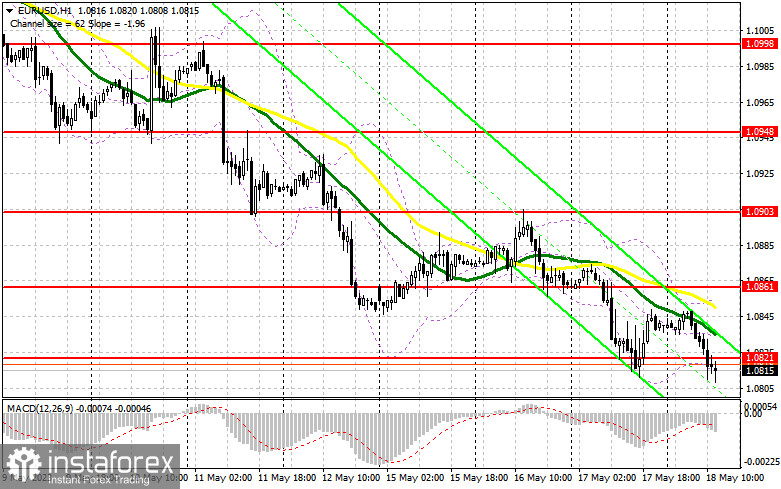
But considering that the bulls have nothing to offer the market yet, it is better to act according to the old scheme: the formation of a false breakout around the new weekly minimum of 1.0786, as well as problems in the US labor market and an increase in claims, will lead to the growth of EUR/USD and a return to the resistance area of 1.0821, missed in the first half of the day. A breakout and a top-down test of this range after the Fed representatives' speeches will strengthen the demand for the euro and form an additional entry point for building long positions with an updated maximum in the area of 1.0861, where moving averages, playing on the side of bears, pass. The furthest target remains the area of 1.0903, where I will fix the profit.
In the event of a further decline in EUR/USD and the absence of buyers at 1.0786 in the second half of the day, and everything is leading to this, further development of the bearish trend can be expected. Therefore, only the formation of a false breakout around the next support of 1.0748 will give a signal to buy the euro. I will open long positions immediately on the rebound from the minimum of 1.0716 with the aim of an upward correction of 30–35 points within the day.
Requirements to open short positions on EUR/USD:
The bears continue to control the market, proving their advantage to everyone. In the event of an upward correction after the real estate market data in the United States, protecting the nearest resistance of 1.0821 will be the priority task of sellers. A false breakout at this level will give a sell signal, pushing the pair further to 1.0786. Consolidation below this range, as well as a reverse test from the bottom up - a direct path to new monthly lows in the region of 1.0748. The furthest target will be the minimum of 1.0716, where profits will be fixed.

In the event of an upward movement of EUR/USD during the American session and the absence of bears at 1.0821, buyers will attempt to return to the market. However, for this to happen, we need quite bad data on the state of the US labor market and a sharp reduction in secondary market sales. In such a case, I will delay short positions until the 1.0861 level. There, you can also sell, but only after an unsuccessful consolidation. I will open short positions immediately on a rebound from the 1.0903 maximum with the aim of a downward correction of 30–35 points.
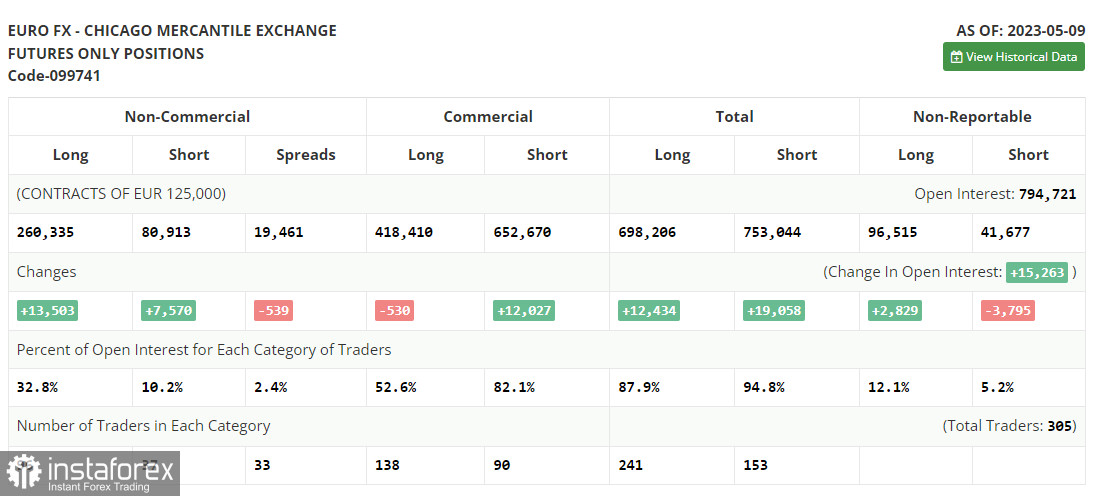
In the May 9 COT report (Commitment of Traders), long positions continued to grow, but short positions also increased. It is worth noting that this report already considers serious changes that occurred in the market after the meetings of the Federal Reserve System and the European Central Bank, and, as we can see, the number of those willing to buy is increasing. At the same time, the corrective movement of the euro downward, which we observed last week, will be a good reason for increasing long positions; we need some good fundamental reasons. Given that there are no important statistics this week and only a sufficient number of central bank representatives are speaking, we can expect the pressure on the pair to continue. The COT report states that long non-commercial positions grew by 13,503 to 260,335, while short non-commercial positions jumped by 7,570 to 80,913. As a result of the week, the total non-commercial net position grew and amounted to 179,422 against 173,489 a week earlier. The weekly closing price decreased and was 1.0992 against 1.1031.

Indicator signals:
Moving Averages
Trading is taking place below the 30- and 50-day moving averages, indicating further development of the bear market.
Note: The author considers the period and prices of moving averages on the H1 hourly chart and differs from the general definition of classical daily moving averages on the D1 daily chart.
Bollinger Bands
In the case of growth, the upper boundary of the indicator at 1.0861 will act as resistance.
Description of indicators:
• Moving average (determines the current trend by smoothing volatility and noise). Period 50. It is marked in yellow on the chart.
• Moving average (determines the current trend by smoothing volatility and noise). Period 30. It is marked in green on the chart.
• MACD indicator (Moving Average Convergence/Divergence - convergence/divergence of moving averages) Fast EMA period 12. Slow EMA period 26. SMA period 9
• Bollinger Bands. Period 20
• Non-commercial traders - speculators, such as individual traders, hedge funds, and large institutions that use the futures market for speculative purposes and meet certain requirements.
• Long non-commercial positions represent the total long open position of non-commercial traders.
• Short non-commercial positions represent the total short open position of non-commercial traders.
• The total non-commercial net position is the difference between non-commercial traders' short and long positions.


