Analysis of EUR/USD on the 5-minute chart

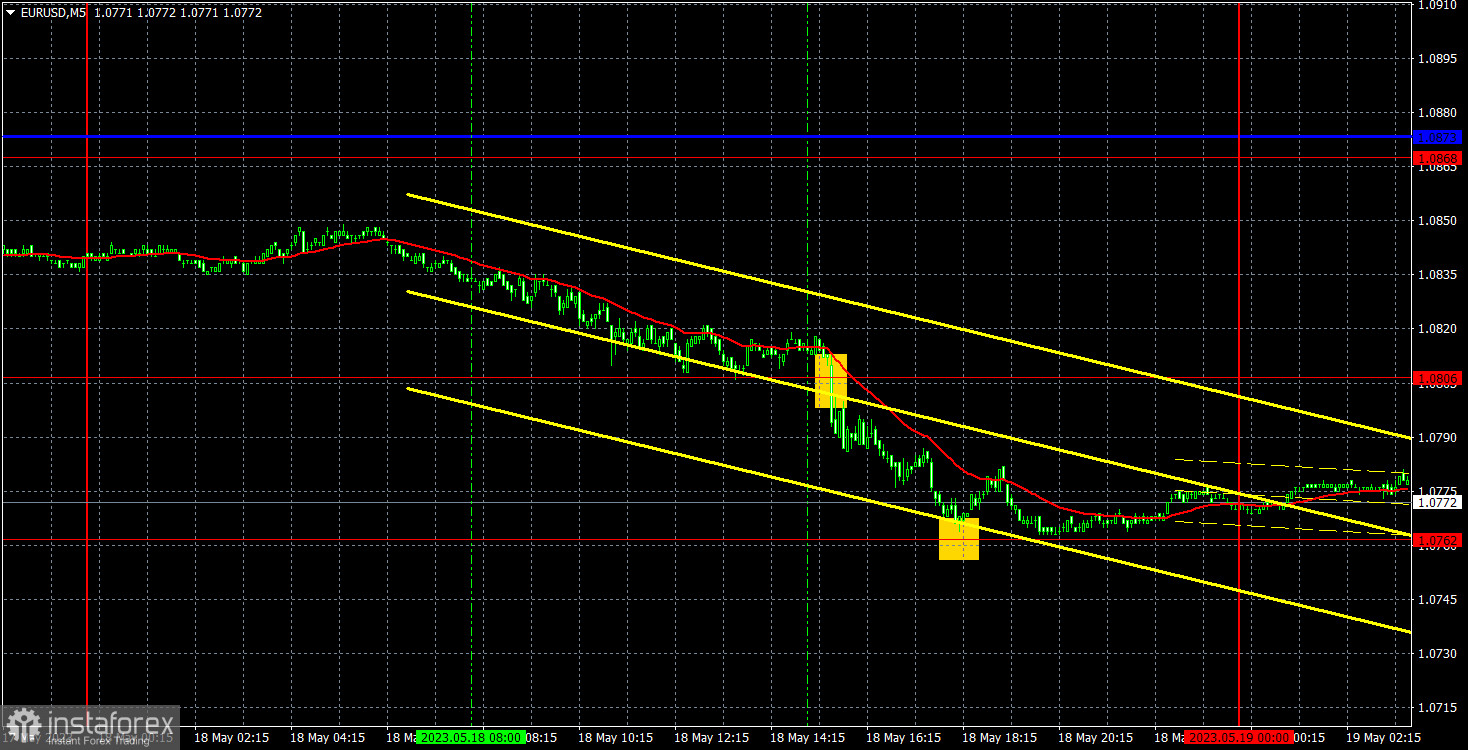
The euro/dollar pair has been falling for the fourth day in a row. In general, the downtrend has been observed for about one week and a half. Every day, the pair loses several dozens of pips. The movement is very similar to what we observed before for two consecutive months. At that time, the euro was growing. Every day, we wrote that its rise was unreasonable and illogical, warning about the inevitable onset of a fall. Now, the pair falls every day. However, this decline is logical, given the overbought conditions and the technical necessity to correct. Notably, judging by the current fundamental and macroeconomic background, this movement seems illogical. The fact is that there have not been such weak reports that might have led to an everyday drop. Nevertheless, the overall (global) fundamental background definitely supports the US dollar.
Only two trading signals were formed yesterday. First, the pair surpassed 1.0806 and then bounced off the 1.0762 level. In the first case, traders could open a short position, and in the second – close it. Since the last signal was formed quite late, it was not necessary to open a long position. The profit from the single transaction was about 20 pips.
COT report:

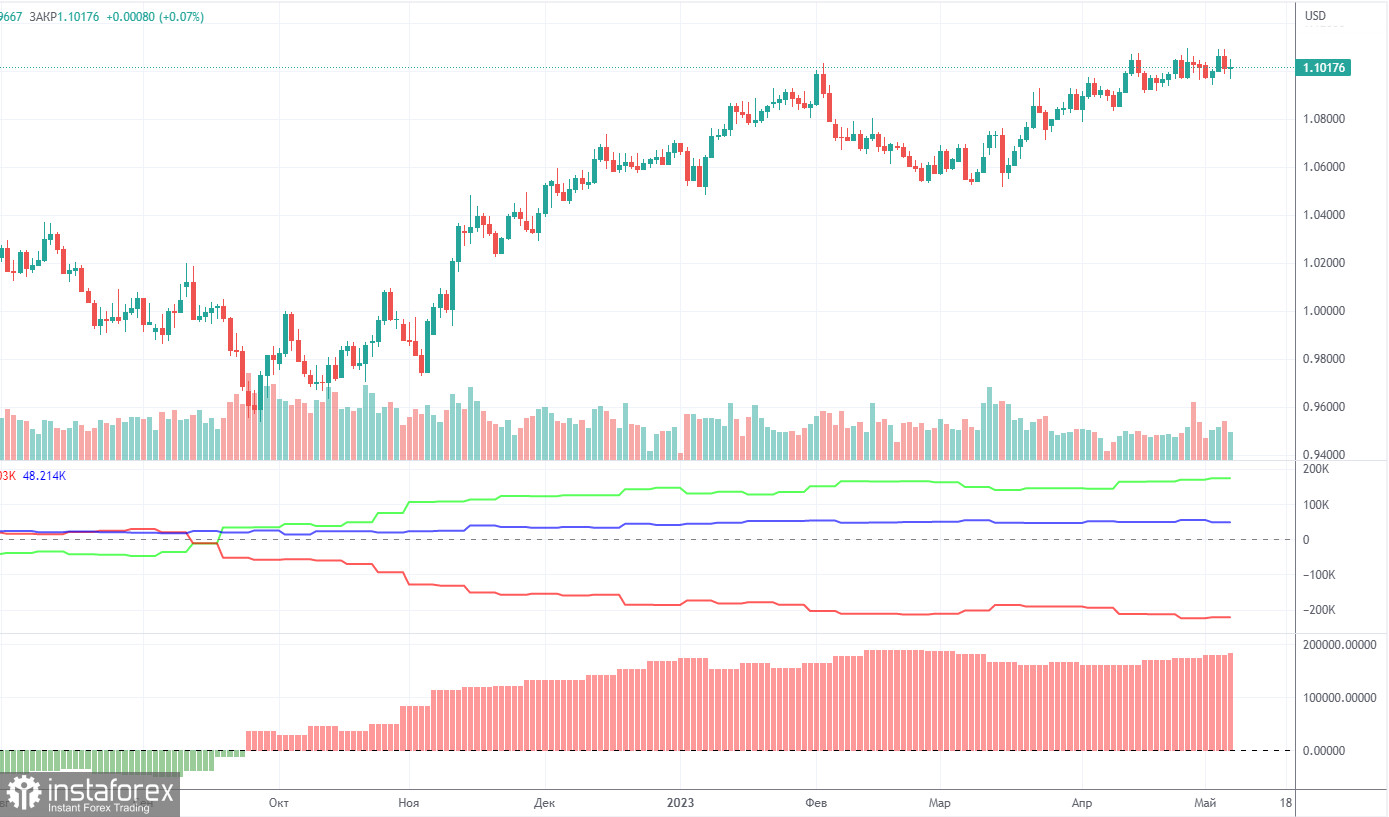
A new COT report from May 9th was released on Friday. In the last 9 months, the COT report data has been fully corresponding to what is happening in the market. The illustration above clearly shows that the net position of major traders (second indicator) began to grow in September 2022. At about the same time, the European currency began to gain in value. At present, the net position of non-commercial traders is bullish. It remains very high and continues to rise following the euro, which so far cannot even correct downwards properly.
We have already drawn traders' attention to the fact that a fairly high net position allows us to assume the imminent completion of an upward trend. This is signaled by the first indicator, where the red and green lines moved far apart, preceding the end of the trend. The euro tried to start falling a few months ago, but we only saw an insignificant pullback. During the last reporting week, the number of buy contracts in the non-commercial group increased by 13.5 thousand, and the number of short contracts surged by 7.5 thousand. Accordingly, the net position advanced by 6 thousand. The number of buy contracts exceeds the number of sell contracts by 180 thousand. This is a very big gap. The difference is more than threefold. A correction is still under question. Even without COT reports, it is clear that the pair should start falling.
Analysis of EUR/USD on the 1-hour chart

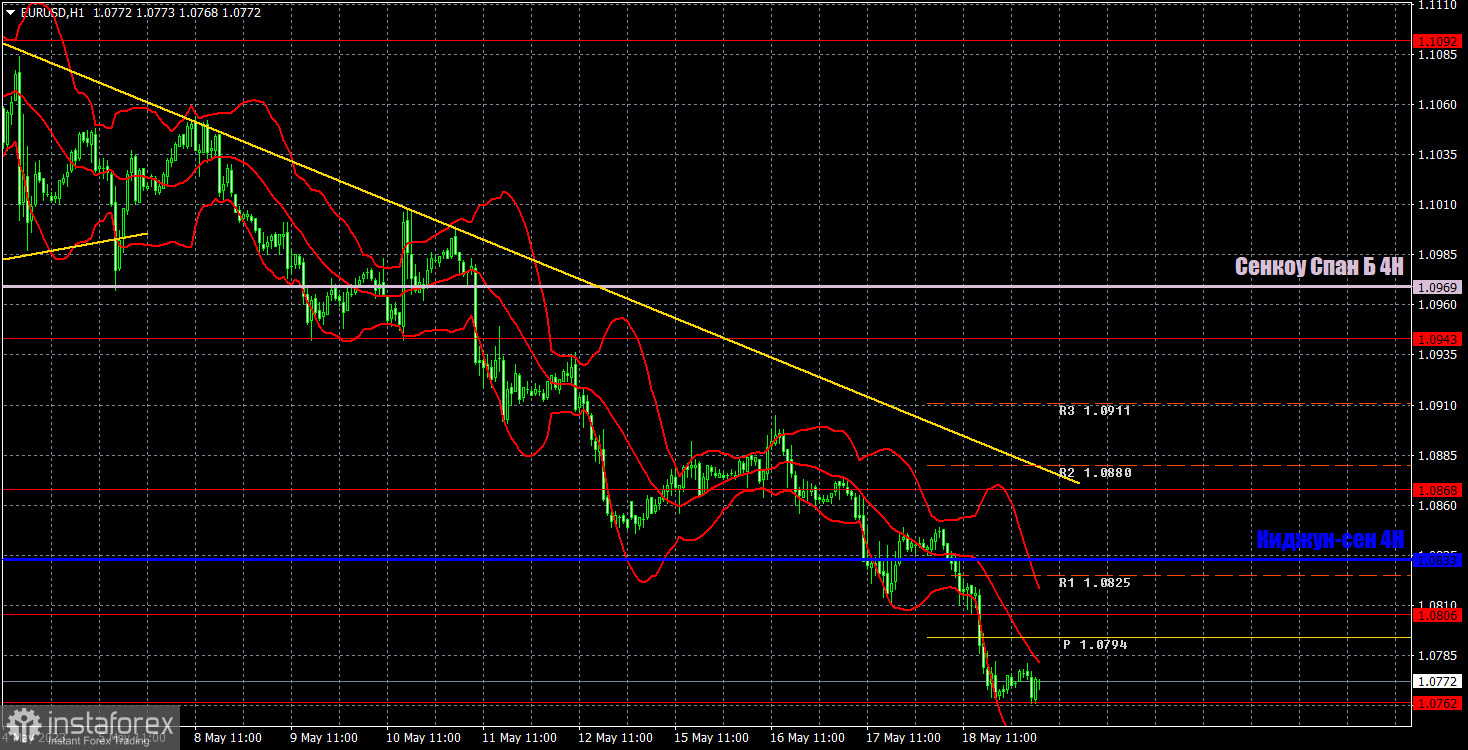
On the hourly chart, the pair continues its downward movement, supported by the trend line. We continue to expect further strengthening of the US currency, as it remains extremely oversold. All technical indicators point to a downward trend. Consolidation above the trend line and the critical line could signal the start of a new uptrend, but currently, the pair is quite far from these limits.
On May 19, we highlight the following levels for trading — 1.0581, 1.0658-1.0669, 1.0762, 1.0806, 1.0868, 1.0943, 1.1092, 1.1137-1.1185, as well as the Senkou Span B lines (1.0969) and Kijun-sen (1.0833). The lines of the Ichimoku indicator may move throughout the day, which should be taken into account when determining trading signals. There are also support and resistance levels, but signals are not formed around them. Bounces and exceeding of extreme levels and lines are also considered to be signals. Do not forget to place a Stop Loss order at break-even if the price moves in the right direction by 15 pips. This will protect against possible losses if the signal turns out to be false.
Today, the head of the ECB, Christine Lagarde, and Federal Reserve Chair Jerome Powell will provide speeches. Both speeches are potentially very important, but Lagarde will start talking only on Saturday. Therefore, we will focus on Powell's comments. However, there may be little or no change in the Fed's rhetoric. There have already been quite a lot of speeches by high-ranking officials over the past week and nothing resonant has been reported to traders.
What we see on the trading charts:
Price levels of support and resistance are thick red lines, near which the movement may end. They do not provide trading signals.
The Kijun-sen and Senkou Span B lines are the lines of the Ichimoku indicator, moved to the one-hour chart from the 4-hour one. They are strong lines.
Extreme levels are thin red lines from which the price bounced earlier. They provide trading signals.
Yellow lines are trend lines, trend channels, and any other technical patterns.
Indicator 1 on the COT charts reflects the net position size of each category of traders.
Indicator 2 on the COT charts reflects the net position size for the non-commercial group.


