


Trend analysis (Fig. 1).
The market may move downward from the level of 1.2442 (closing of Friday's daily candle) with the target at 1.2343, the lower fractal (blue dotted line). Upon reaching this level, the price may continue to move down with the target of 1.2315, the lower limit of the Bollinger Band indicator (black dotted line).
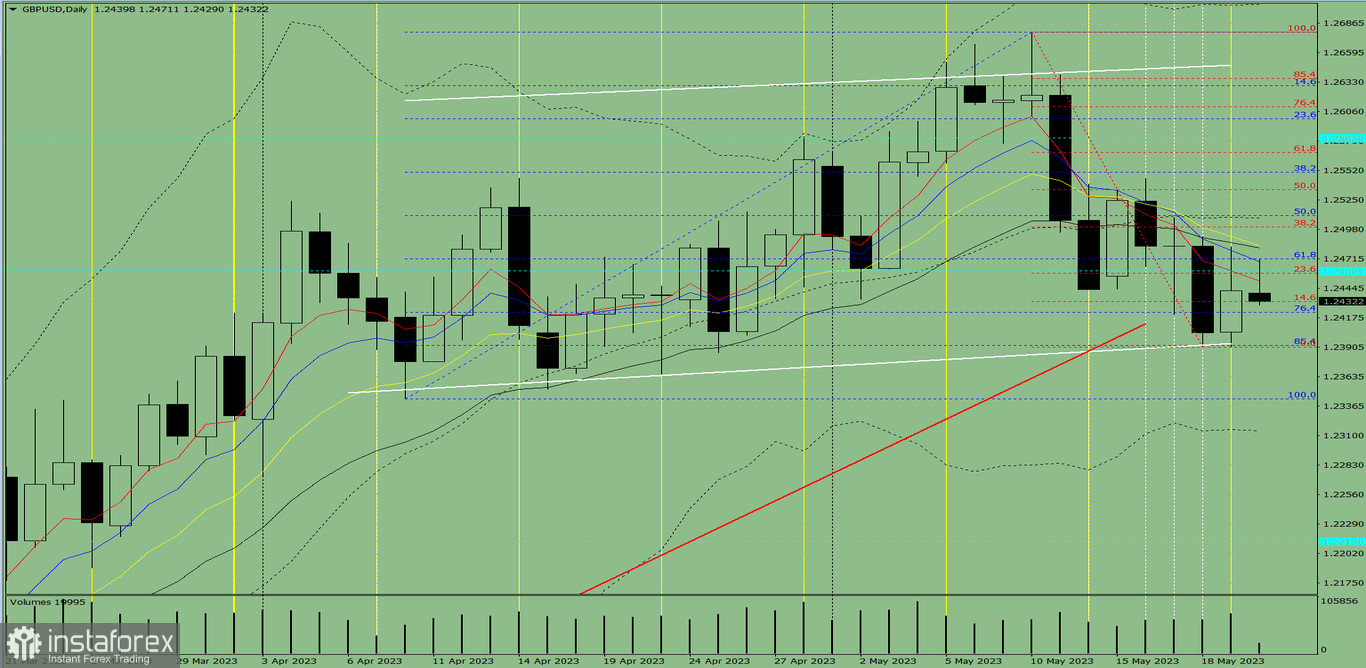
Fig. 1 (daily chart).
Comprehensive analysis:
- Indicator analysis - down;
- Fibonacci levels - down;
- Volumes - down;
- Candlestick analysis - down;
- Trend analysis - up;
- Bollinger bands - down;
- Weekly chart - down.
General conclusion:
Today, the price may move downward from the level of 1.2442 (closing of Friday's daily candle) with the target at 1.2343, the lower fractal (blue dotted line). Upon reaching this level, the price may continue to move down with the target of 1.2315, the lower limit of the Bollinger Band indicator (black dotted line).
Alternatively, the price may move downward from the level of 1.2442 (closing of Friday's daily candle) with the target of 1.2343, the lower fractal (blue dotted line). Upon reaching this level, an upward movement is possible with the target of 1.2391, the lower fractal (red dotted line).


