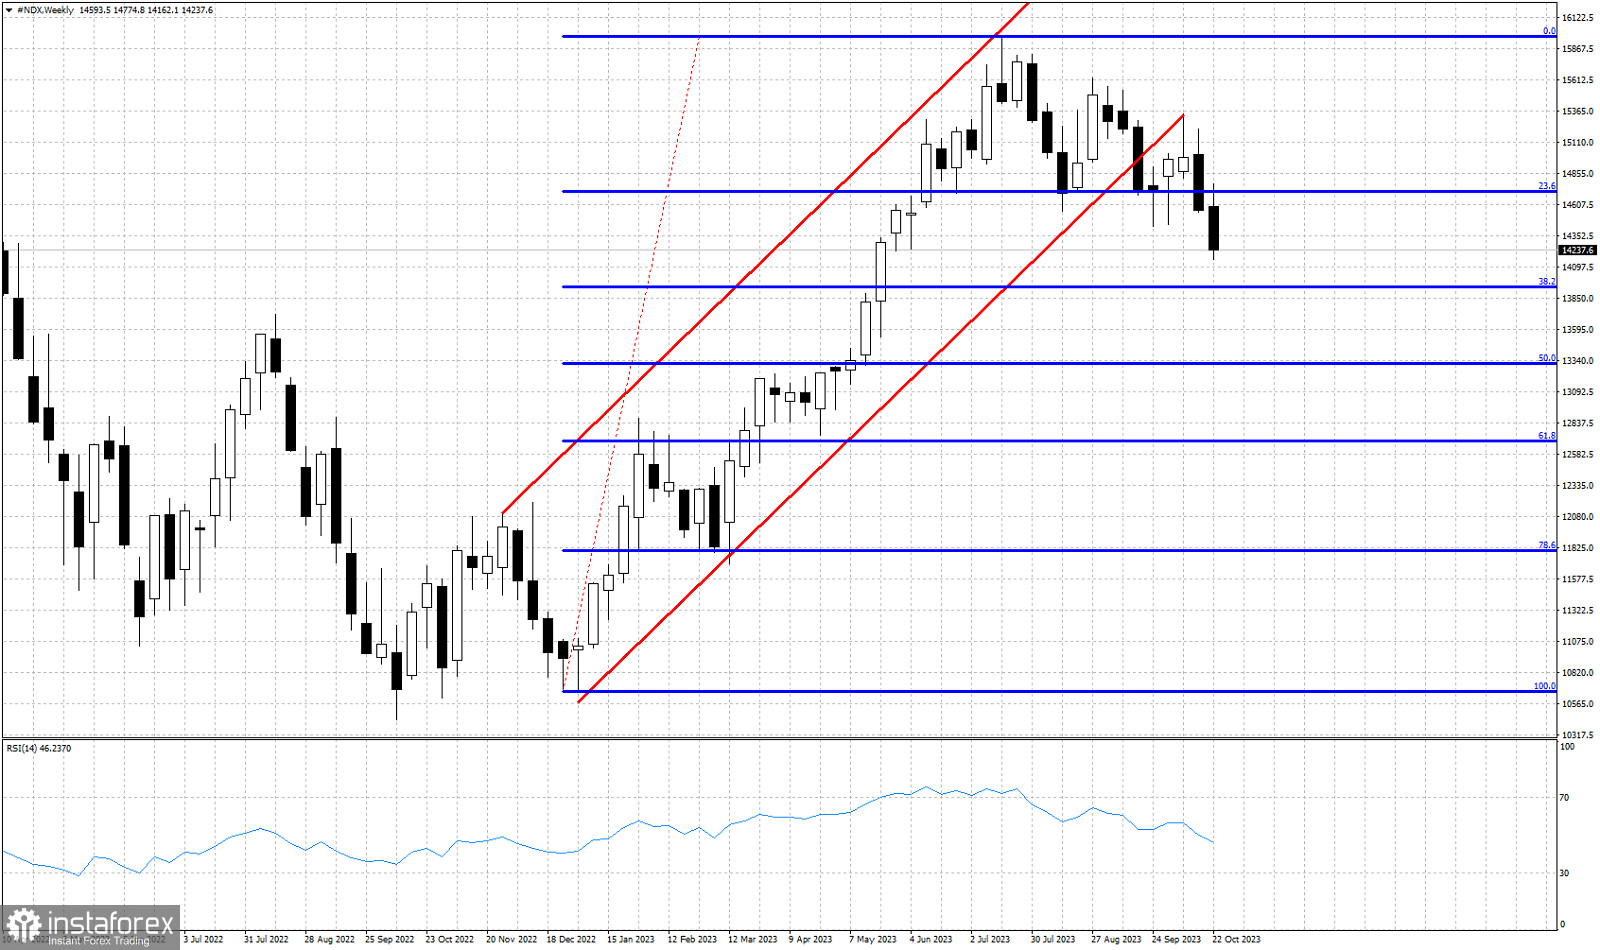
Red lines- bullish channel
Blue lines- Fibonacci retracement levels
Nasdaq is trading around 14,240. Price recently broke to new lower lows below the 23.6% Fibonacci retracement. As was expected by our previous posts, Nasdaq index is moving lower towards the key Fibonacci 38% retracement level at 13,945. Since the break out of the bullish channel we warned traders that Nasdaq index was vulnerable to a pull back. Price has started forming lower lows and lower highs over the last 3 months. We continue to be bearish NASDAQ as long as price holds below the recent high at 15,330.


