


Weekly Review:
The EUR/USD pair hit the weekly pivot point and resistance 1, because of the series of relatively equal highs and equal lows. But, the pair has risen down in order to top at the point of 1.0588. Hence, the major support was already set at the level of 1.0545.
Today, the EUR/USD pair has broken resistance at the level of 1.0588 which acts as support now. Thus, the pair has already formed major support at 1.0545.The strong support is seen at the level of 1.0545 because it represents the weekly support 1.
Equally important, the RSI and the moving average (100) are still calling for an uptrend. Therefore, the market indicates a bullish opportunity at the level of 1.0600 in the H1 chart. Also, if the trend is buoyant, then the currency pair strength will be defined as following: EUR is in an uptrend and USD is in a downtrend.
Buy above the major support of 1.0545 (this price is coinciding with the ratio of 50% Fibonacci) with the first target at 1.0640 , and continue towards 1.0675 (the weekly resistance 1). On the other hand, if the price closes below the support (1.0545 ), the best location for the stop loss order is seen below 1.0545; hence, the price will fall into the bearish market in order to go further towards the strong support at 1.0494 to test it again. Furthermore, the level of 1.0450 will form a double bottom.
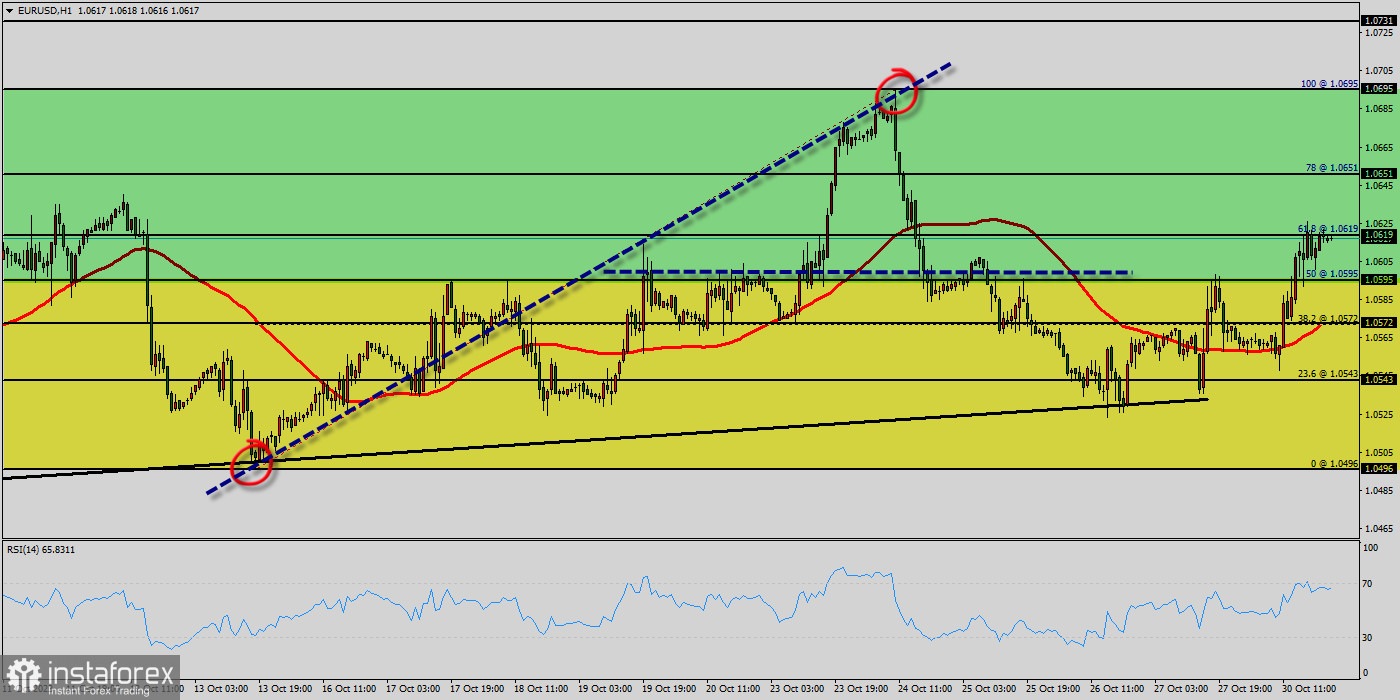
the EUR/USD pair broken resistance at the level of 1.0507 which acts as support now. Thus, the pair has already formed minor support at 1.0507. The strong support is seen at the level of 1.0496 because it represents the weekly support 1.
Equally important, the RSI and the moving average (100) are still calling for an uptrend. Therefore, the market indicates a bullish opportunity at the level of 1.0507 in the H1 chart. Also, if the trend is buoyant, then the currency pair strength will be defined as following: GBP is in an uptrend and USD is in a downtrend.
Buy above the minor support of 1.0507 with the first target at 1.0619 (this price is coinciding with the ratio of 61.8% Fibonacci), and continue towards 1.0619 (the weekly resistance 1). The level of 1.0619 coincides with a golden ratio (61.8% of Fibonacci), which is expected to act as major support today. The Relative Strength Index (RSI) is considered overbought because it is above 35. The RSI is still signaling that the trend is upward as it is still strong above the moving average (100). This suggests the pair will probably go up in coming hours. Accordingly, the market is likely to show signs of a bullish trend.
Long term :
The EUR/USD pair steadies near 1.0571 after USD slide. The EUR/USD pair reached a peak of 1.0571 following the release of a weak ISM Services PMI report from the US. The EUR/USD pair is currently hovering near the 1.0571 level, unchanged for the day. The EUR/USD pair trades with modest losses, not far above the two-week low posted last week at 1.0636.
Technical readings in the daily chart favor a downward extension as a bearish 50 Simple Moving Average (SMA) heads south below a flat 100 SMA, both above the current level. Also, the pair remains above a critical static support level, the 23.6% Fibonacci retracement of the 2023 yearly slump at 1.0682.
Finally, technical indicators remain within positive levels, with neutral-to-bullish slopes. The EUR/USD pair broke resistance which turned to strong support at the level of 1.0682 yesterday. The level of 1.0682 coincides with 23.6% of Fibonacci, which is expected to act as major support today. Since the trend is above the 23.6% Fibonacci level, the market is still in an uptrend.
From this point, the EUR/USD pair is continuing in a bullish trend from the new support of 1.0682. Currently, the price is in a bullish channel. According to the previous events, we expect the EUR/USD pair to move between 1.0682 and 1.0789.
On the H1 chart, resistance is seen at the levels of 1.0757 and 1.0789. Also, it should be noticed that, the level of 1.0734 represents the daily pivot point. Therefore, strong support will be formed at the level of 1.0682 providing a clear signal to buy with the targets seen at 1.0734.
If the trend breaks the support at 1.0734 (first resistance) the pair will move upwards continuing the development of the bullish trend to the level 1.0789 in order to test the daily resistance 2. However, stop loss is to be placed below the level of 1.0636 - last bearish wave. The EUR/USD pair continues to move upwards from the level of 1.0687. The pair rose from the level of 1.0687 to a top around 1.0754. Today, the first support level is seen at 1.0687 followed by 1.0600, while daily resistance 1 is seen at 1.0785.
According to the previous events, the EUR/USD pair is still moving between the levels of 1.0687 and 1.0785; for that we expect a range of 98pips (1.0785 - 1.0687). On the one-hour chart, immediate resistance is seen at 1.0785, the first bullish wave. Currently, the price is moving in a bullish channel. This is confirmed by the RSI indicator signaling that we are still in a bullish trending market. The price is still above the moving average (100) and (50).
Therefore, if the trend is able to break out through the first resistance level of 1.0785, we should see the pair climbing towards the daily resistance at 1.0808 to test it. It would also be wise to consider where to place stop loss; this should be set below the second support of 1.0687.


