


USD/JPY:
On the weekly chart, the price has surpassed the resistance of the embedded price channel line, the balance indicator line (red), and the MACD indicator line (blue).
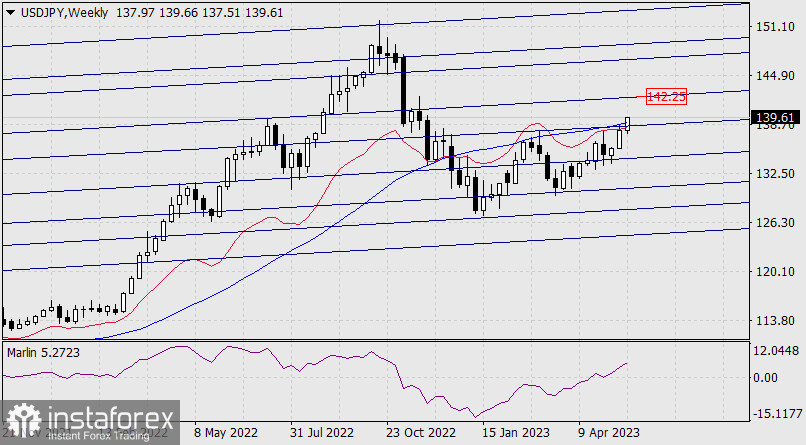
The price is on track for long-term growth. The nearest resistance and target is the closest line of the ascending hyperchannel at 142.25.
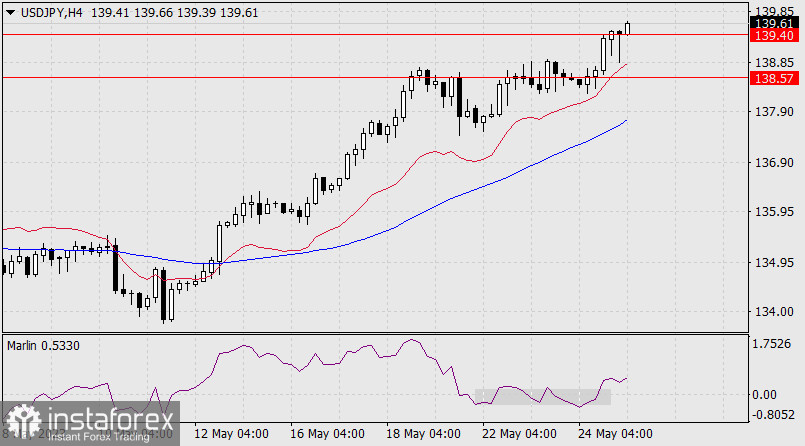
On the 4-hour chart, the price is rising above the balance and MACD indicator lines. The Marlin oscillator, after a short-term consolidation at the zero neutral level, is now heading upwards. With this technical picture, the bulls have the advantage in the short-term trend.


