


Analyzing Tuesday's trades:
GBP/USD on 30M chart
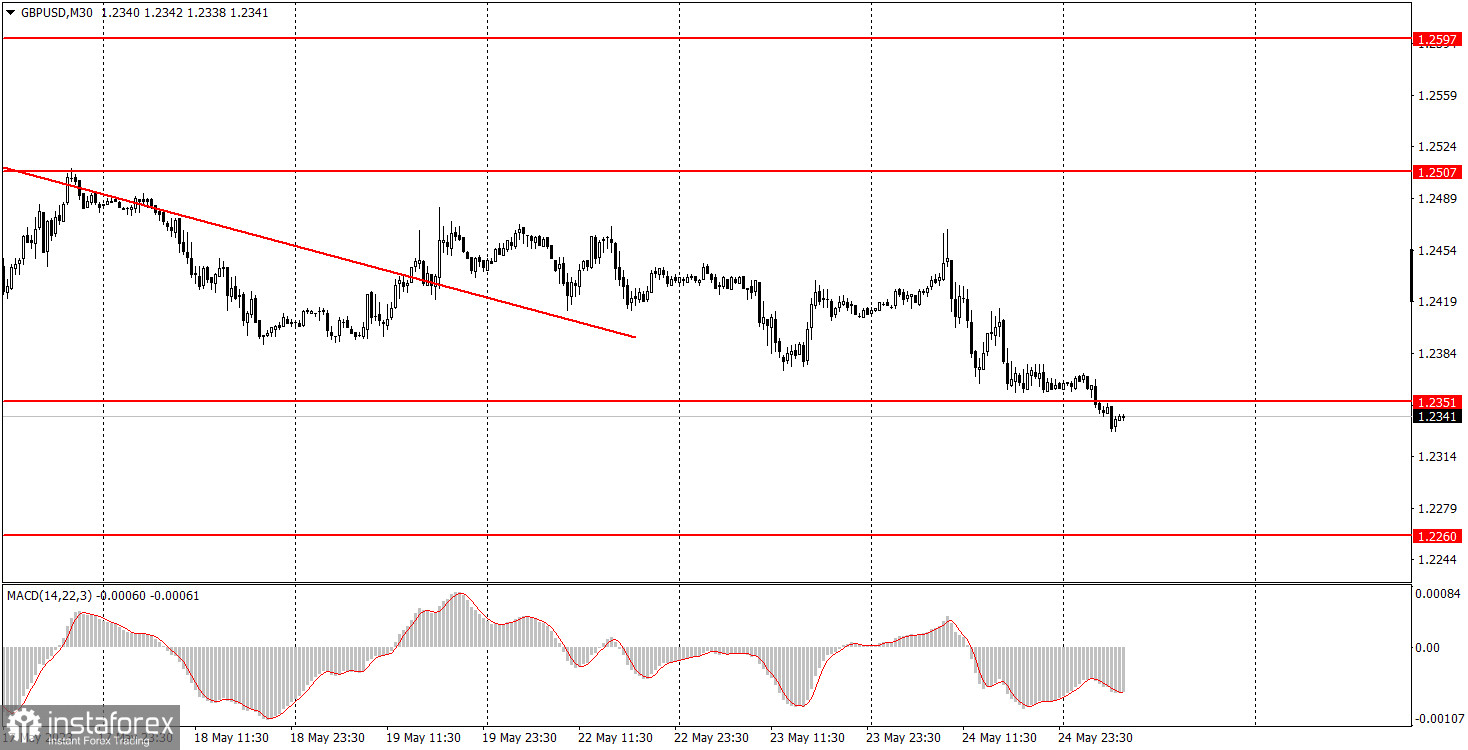
On Wednesday, the GBP/USD pair continued to trade lower, despite consolidating above the descending trend line. However, I warned you that this time even if the pair breaches the trendline, this doesn't mean the end of the downtrend, and that's exactly what happened. The British pound continues to fall because it simply doesn't have any other options. The British currency remains significantly overbought. The fundamental and macroeconomic backdrop currently plays no significant role. It may only have an impact on the pair within the day. A prime example of this is Bank of England Governor Andrew Bailey's speech on Tuesday. He mentioned the possibility of a stronger interest rate hike and it was a hawkish stance, but the pound didn't respond with an upward reversal. As for yesterday's UK inflation report, it can be interpreted in various ways.
As a result, we have a situation opposite to what we observed during the last two months, before it fell. Regardless of the backdrop, the pair is moving in only one direction. Trading on the 5-minute chart can be quite challenging as there are frequent pullbacks and bullish corrections.
GBP/USD on 5M chart
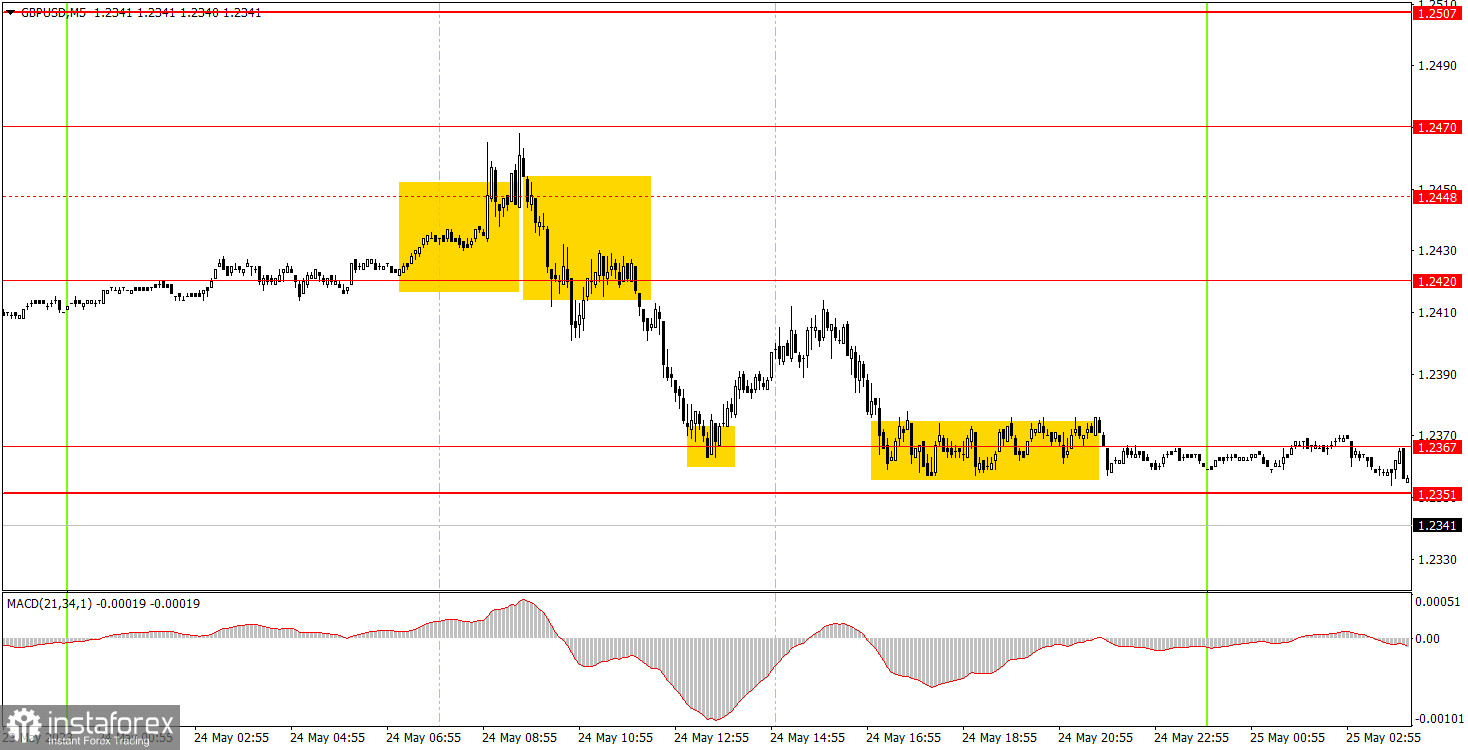
There were several trading signals on the 5-minute chart. The 1.2448 level has been removed from the charts, and the 1.2470 level has been added instead. The first buy signal, which was based on breaching the 1.2420-1.2448 range, turned out to be false. However, novice traders should have ignored it because it coincided with the release of the UK inflation report, which is considered highly important. Nevertheless, the next sell signal could have been executed, and the pair subsequently reached the nearest target level of 1.2367 and bounced off it. You could gain around 30 pips of profit. The bounce from 1.2367 could also have been executed, but the price missed the target level by just 6 pips, so it wasn't possible to lock in profits from the long position. The trade closed at breakeven with the stop loss.
Trading tips on Thursday:
On the 30-minute chart, the GBP/USD pair tried to break the downtrend. It breached the trendline last Friday. However, it has not entered a bullish correction. I still believe that the downward movement will likely persist in the medium term. On the 5M chart, the key levels can be found at 1.2171-1.2179, 1.2245-1.2260, 1.2351-1.2367, 1.2420, 1.2470, 1.2507-1.2520, 1.2597-1.2616, 1.2659, 1.2697. When the price moves in the correct direction by 20 pips after entering a trade, a stop loss order can be placed to breakeven. On Thursday, there are no notable events scheduled in the UK. And the US will only release a couple of minor reports. Today's volatility may again be relatively low.
Basic rules of the trading system:
1) The strength of the signal depends on the time period during which the signal was formed (a rebound or a break). The shorter this period, the stronger the signal.
2) If two or more trades were opened at some level following false signals, i.e. those signals that did not lead the price to Take Profit level or the nearest target levels, then any consequent signals near this level should be ignored.
3) During the flat trend, any currency pair may form a lot of false signals or do not produce any signals at all. In any case, the flat trend is not the best condition for trading.
4) Trades are opened in the time period between the beginning of the European session and until the middle of the American one when all deals should be closed manually.
5) We can pay attention to the MACD signals in the 30M time frame only if there is good volatility and a definite trend confirmed by a trend line or a trend channel.
6) If two key levels are too close to each other (about 5-15 pips), then this is a support or resistance area.
How to read charts:
Support and Resistance price levels can serve as targets when buying or selling. You can place Take Profit levels near them.
Red lines are channels or trend lines that display the current trend and show which direction is better to trade.
MACD indicator (14,22,3) is a histogram and a signal line showing when it is better to enter the market when they cross. This indicator is better to be used in combination with trend channels or trend lines.
Important speeches and reports that are always reflected in the economic calendars can greatly influence the movement of a currency pair. Therefore, during such events, it is recommended to trade as carefully as possible or exit the market in order to avoid a sharp price reversal against the previous movement.
Beginners should remember that every trade cannot be profitable. The development of a reliable strategy and money management are the key to success in trading over a long period of time.


